
Multigrade Progression Overview

Explore the Grades 6-8 Progression
The structure of this Progression Overview web page is similar to the structure of the web pages for each PLC Video. To better understand how this Professional Learning Course would benefit math coaches and teachers, watch the video and discuss some Questions and Prompts with a colleague.
Watch the Progression Overview Video.
Then, with a colleague, discuss the Questions and Prompts listed below the professional learning video.
Finally, reflect on how the discussion of the Questions and Prompts challenged you and your colleague to dig deeper into the mathematics and instructional strategies presented in the video.
Progression Overview Video
Grades 6-8 Ratio and Proportional Relationships
Overview of Multigrade Progressions in a Professional Learning Course
Grades 6-8 Professional Learning Course
Overview Video Objectives
Grade 6 - Explore intuitive-transitional-formal representations and strategies for ratios and identify how this same progression applies to rates, percents, and conversions.
Grade 7 - Apply representations and strategies from grade 6 to make sense of novel proportional contexts, organize and apply formal multiplier strategies, and build algebraic representations of proportional relationships.
Grade 8 - Apply algebraic representations for proportional relationships introduced in grade 7 to solve problems involving similar triangles and slope of a line.
PLC Questions and Prompts
Note: This Progression Overview Video covers a significant amount of content and is longer than most PLC Videos. So, the Questions and Prompts section is 3 to 4 times as long as the Questions and Prompts sections for a typical PLC Video. If using this video for professional learning or development purposes, it is recommended that the Questions and Prompts section be split into grade 6, grade 7, and grade 8 sessions.
Grade 6
This Professional Learning Course charts an in-depth exploration of representations, strategies, and concepts for ratio and proportional relationships. These representations and strategies span a continuum from intuitive to formal.
Review the ratio and proportional representations on the continuum.
Discuss possible reasons why each representation might be categorized as intuitive, transitional, or formal.
Note: One goal for this video is to introduce the terms intuitive, transitional, and formal to identify the representations, strategies, and concepts introduced at each stage of the progression. This particular prompt is designed to elicit prior knowledge. See the Technical Details section below for more precise definitions of the stages of a mathematics learning progression.
1.
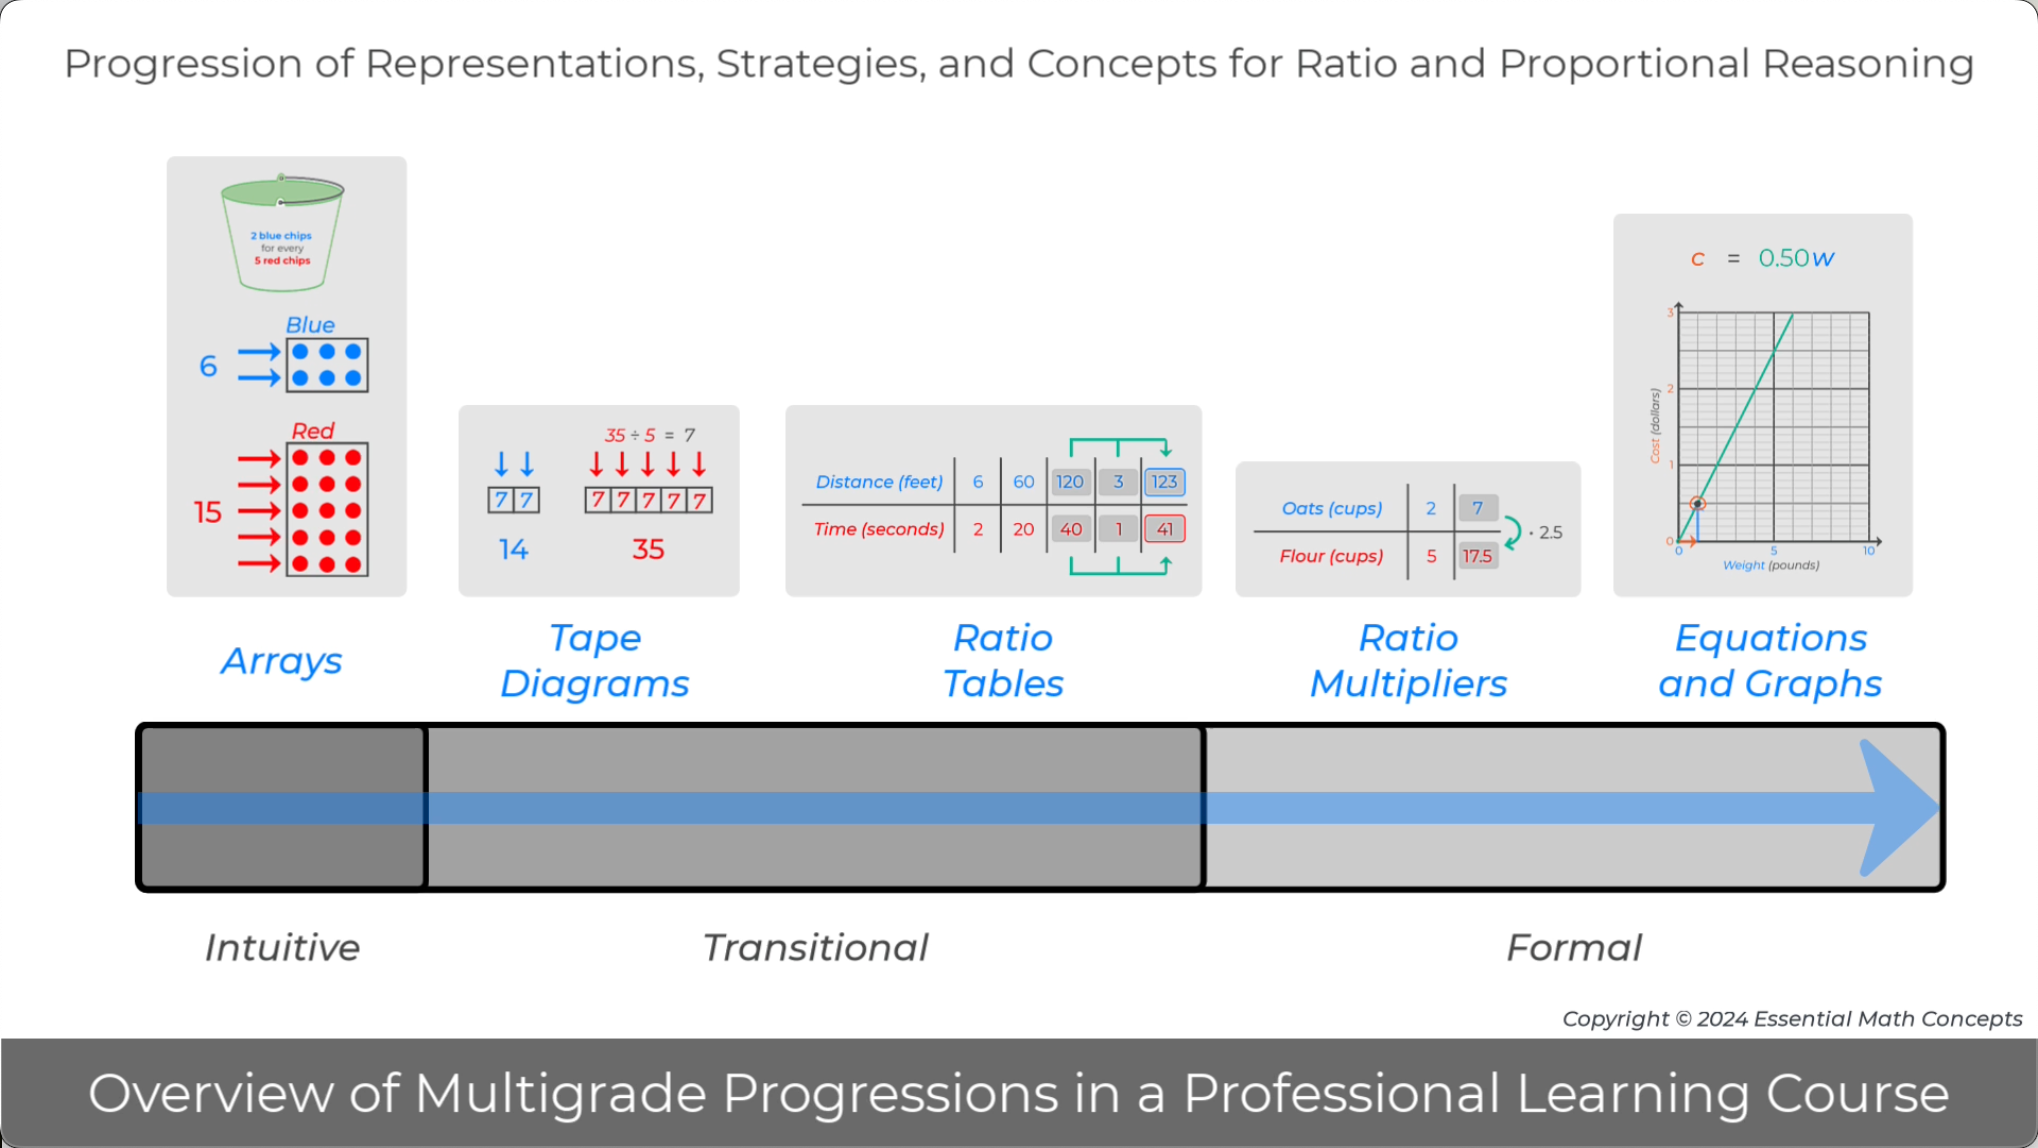
Image - Video Pause Point 0:16
Rectangular array diagrams can be introduced to solve basic ratio problems because the structure of the diagram allows students to intuitively organize equivalent ratios.
Discuss how the given ratio in the problem dictated the structure of the arrays and is organized in the array diagram.
Explain how the structure of the array diagram allows students to solve the ratio problem by applying a few simple strategies.
Discuss how the array diagram clearly shows whether a new ratio maintains or satisfies the original ratio.
2.

Image - Video Pause Point 0:44
Making additional copies of a ratio, and appending those copies to the original ratio, always generates a new ratio that maintains or satisfies the original ratio. New ratios that maintain or satisfy an original (simplified) ratio can be identified as equivalent ratios.
Discuss why this intuitive definition of equivalent ratios is useful for introducing basic ratio concepts.
Identify why this intuitive definition will require a more precise or formal definition as students explore more complex ratio problems.
3.
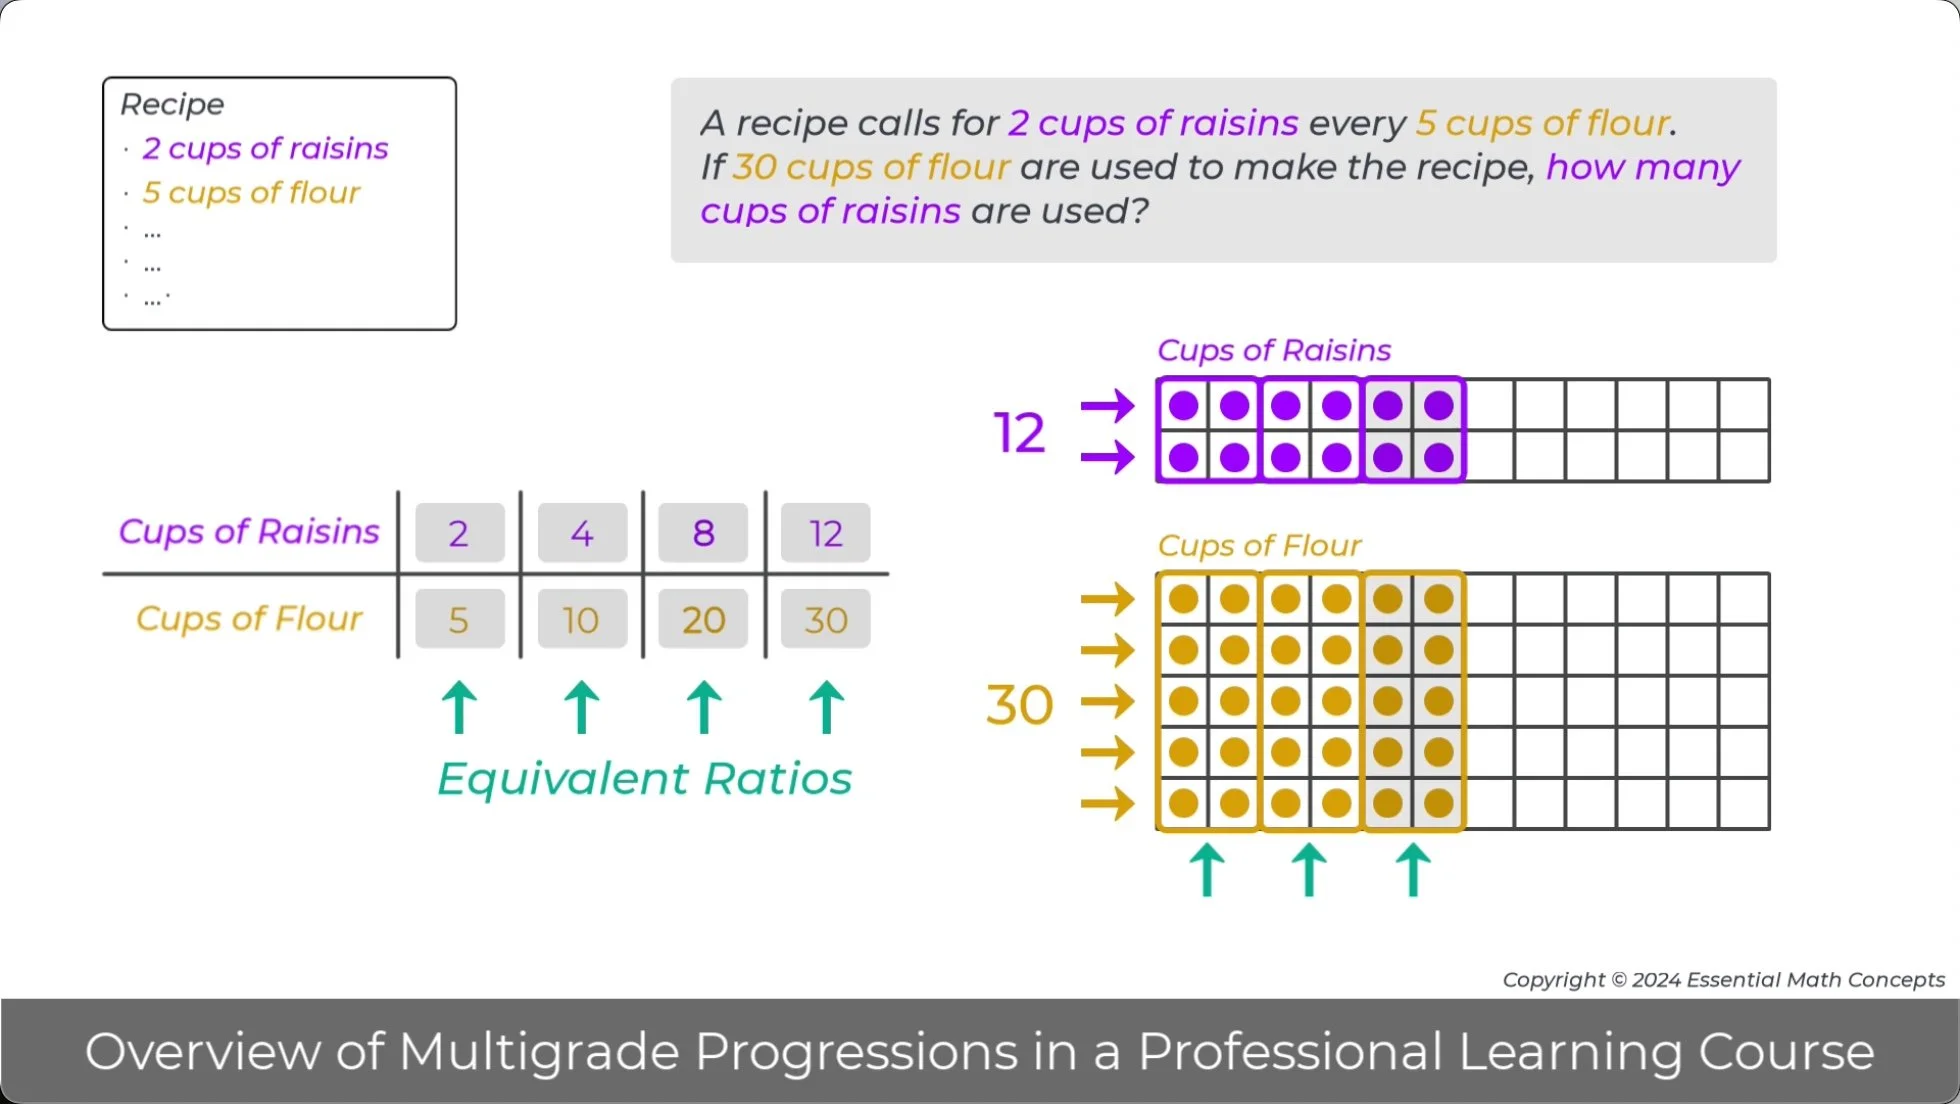
Image - Video Pause Point 0:52
Intuitive representations and strategies are useful for introducing foundational concepts for a given topic.
Discuss how the array diagrams justify why this basic multiplier strategy can be used to generate equivalent ratios.
4.

Image - Video Pause Point 1:00
Another benefit of intuitive array diagrams is that they can be used to justify transitional ratio table strategies. The “multiply” strategy, which was justified in the previous prompt, is an example.
Discuss how the “combine” strategy, which is demonstrated below, can be justified using the chips in the arrays.
Discuss how the array diagrams can be used to show that an incorrect strategy, adding the same value to both quantities in a ratio, does not generate an equivalent ratio.
5.

Image - Video Pause Point 1:16
In the example below, a series of transitional ratio table strategies were used to solve a basic ratio problem. Transitional strategies can be thought of as more efficient versions of intuitive strategies, where representing each item in a ratio is replaced by two values in the column of a table. This transition emphasizes that solving a ratio problem involves generating a new ratio that is equivalent to the given ratio in a problem.
Use ratio table strategies to generate additional columns (equivalent ratios) in the table. Then, write a new ratio problem that could be solved using a new equivalent ratio.
6.
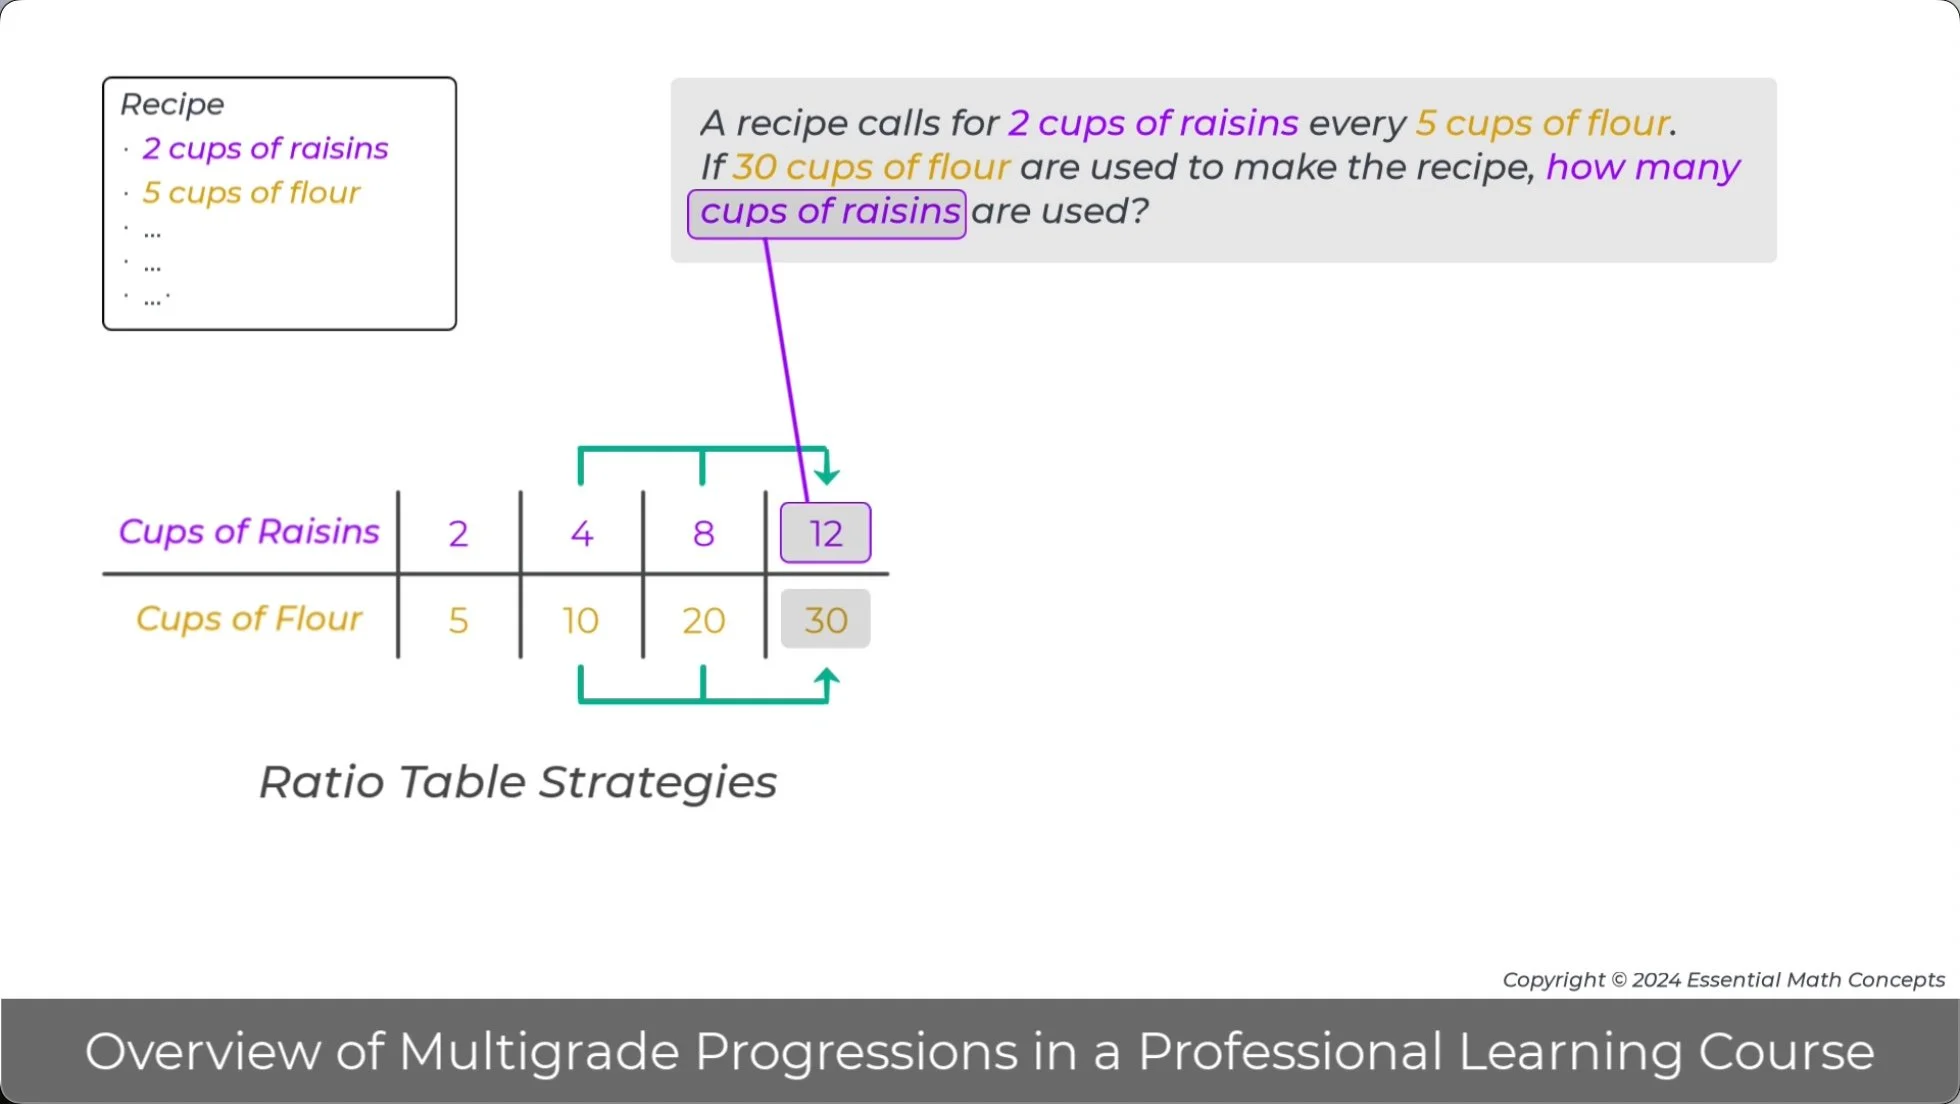
Image - Video Pause Point 1:21
Formal multiplier strategies for ratios use the transitional representation, ratio tables, to organize the given values in the problem.
Discuss how the ratio table is a natural way to organize the values in a ratio problem. Then, thinking ahead to grade 7, discuss how the values in a ratio table can be used to structure a proportion.
7.
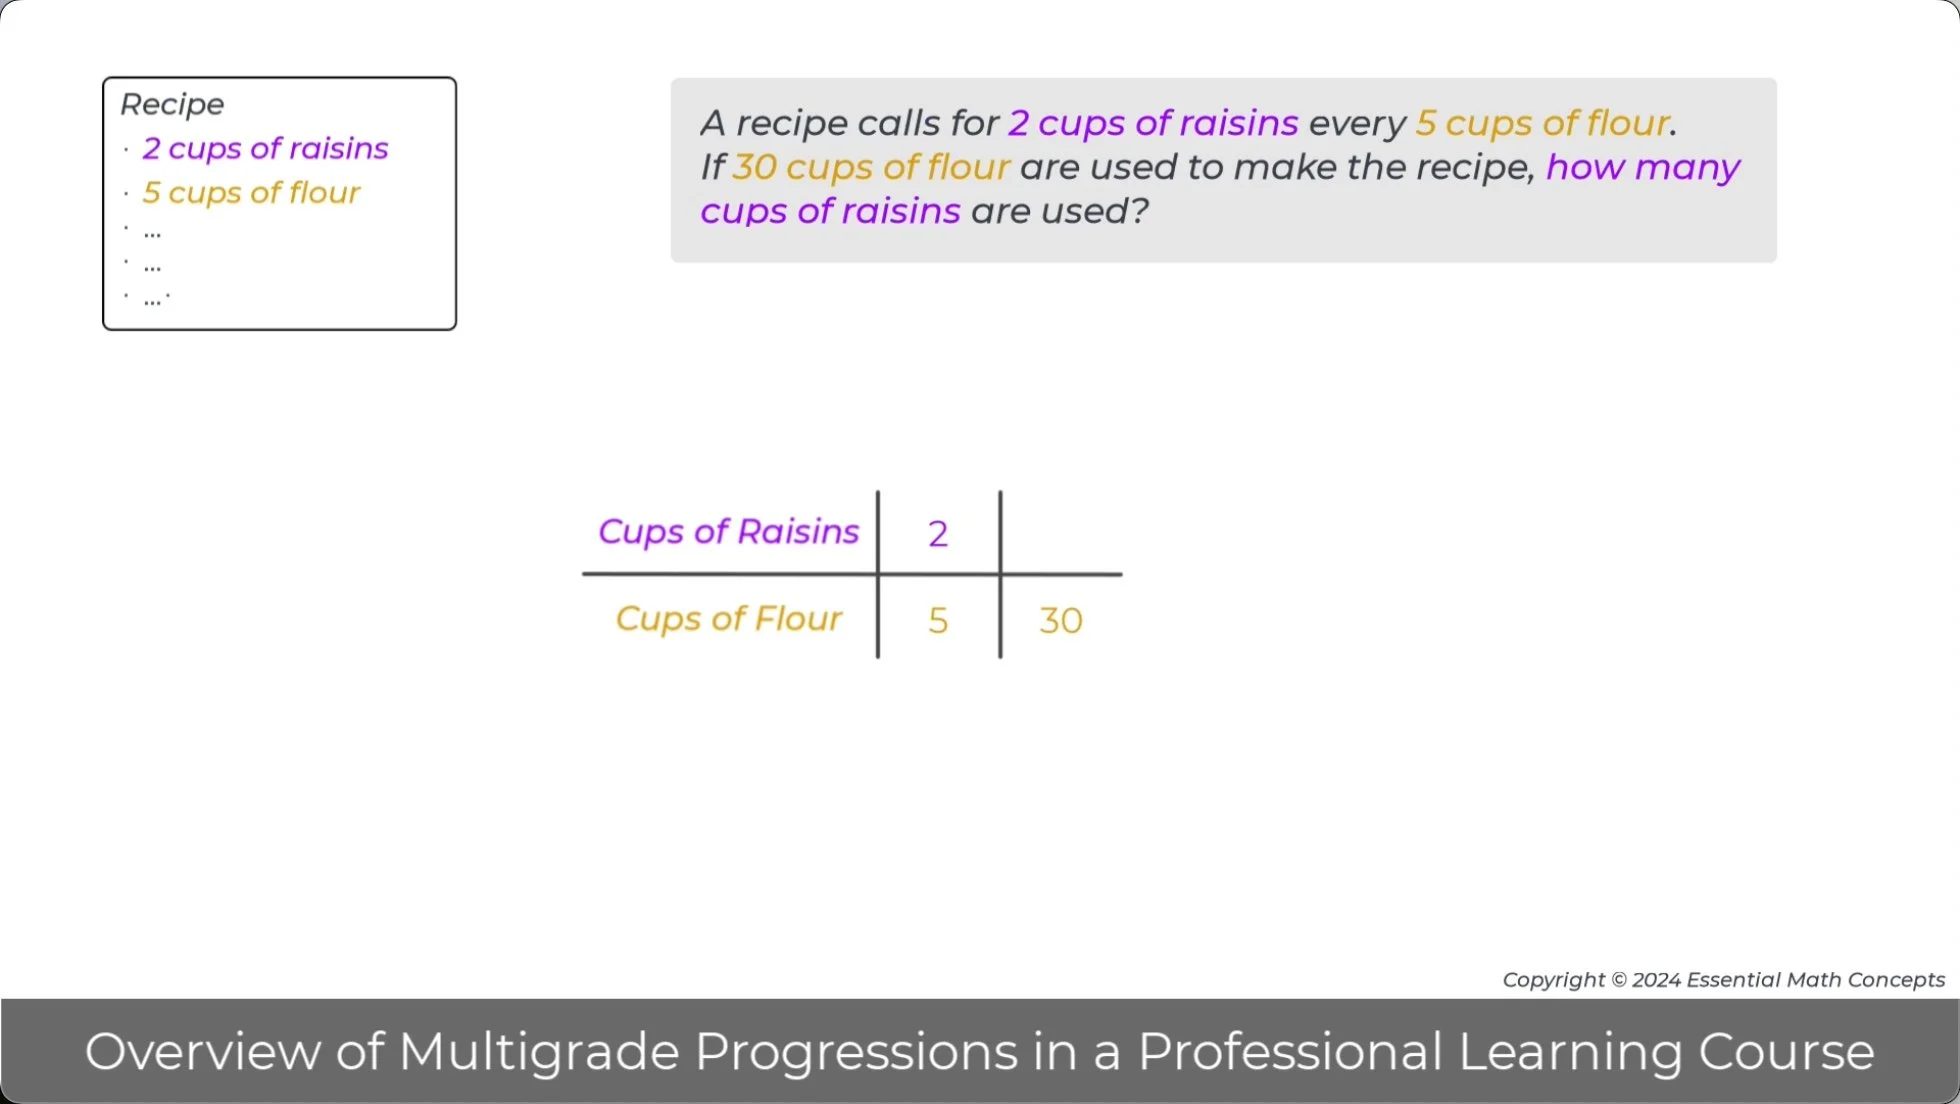
Image - Video Pause Point 1:28
Once the given values in a ratio problem are organized in a ratio table, a multiplier arrow, that will solve the problem, can be drawn to the right of the table. Then, the values in the given ratio can be used to write and solve a multiplier equation.
Discuss how the structure of the ratio table will help students structure the multiplier equation.
Explain how the multiplier equation is solved and applied to solve the ratio problem. F
Explain how this multiplier can be applied to solve different problems that involve the ratio of 2 cups of raisins to 5 cups of flour.
Note: The multiplier relationship between the two quantities in ratio can be referred to as the internal ratio multiplier (and its reciprocal). The basic multiplier relationship, explored earlier in this video, relates the like quantities in two equivalent ratios and can be referred to as an external ratio multiplier.
8.

Image - Video Pause Point 1:34
The grade 6 progression for ratio representations and strategies is mirrored in the progression for rates, percents, and unit conversions. For example, the progression for rates includes the following representations and strategies, double number lines (intuitive), ratio tables (transitional), and multipliers (formal).
Discuss how repeating this progression for each proportional topic at grade 6 builds a solid foundation for more advanced work with proportional relationships at grades 7 and 8.
9.

Image - Video Pause Point 1:44
Grade 7
In grade 7, intuitive representations from grade 6 are used to help students make sense of more complex ratio, rate, and percent problems.
Discuss how the double number line and percent bars below are used to make sense of these more complex proportional problems.
10.

Image - Video Pause Point 1:53
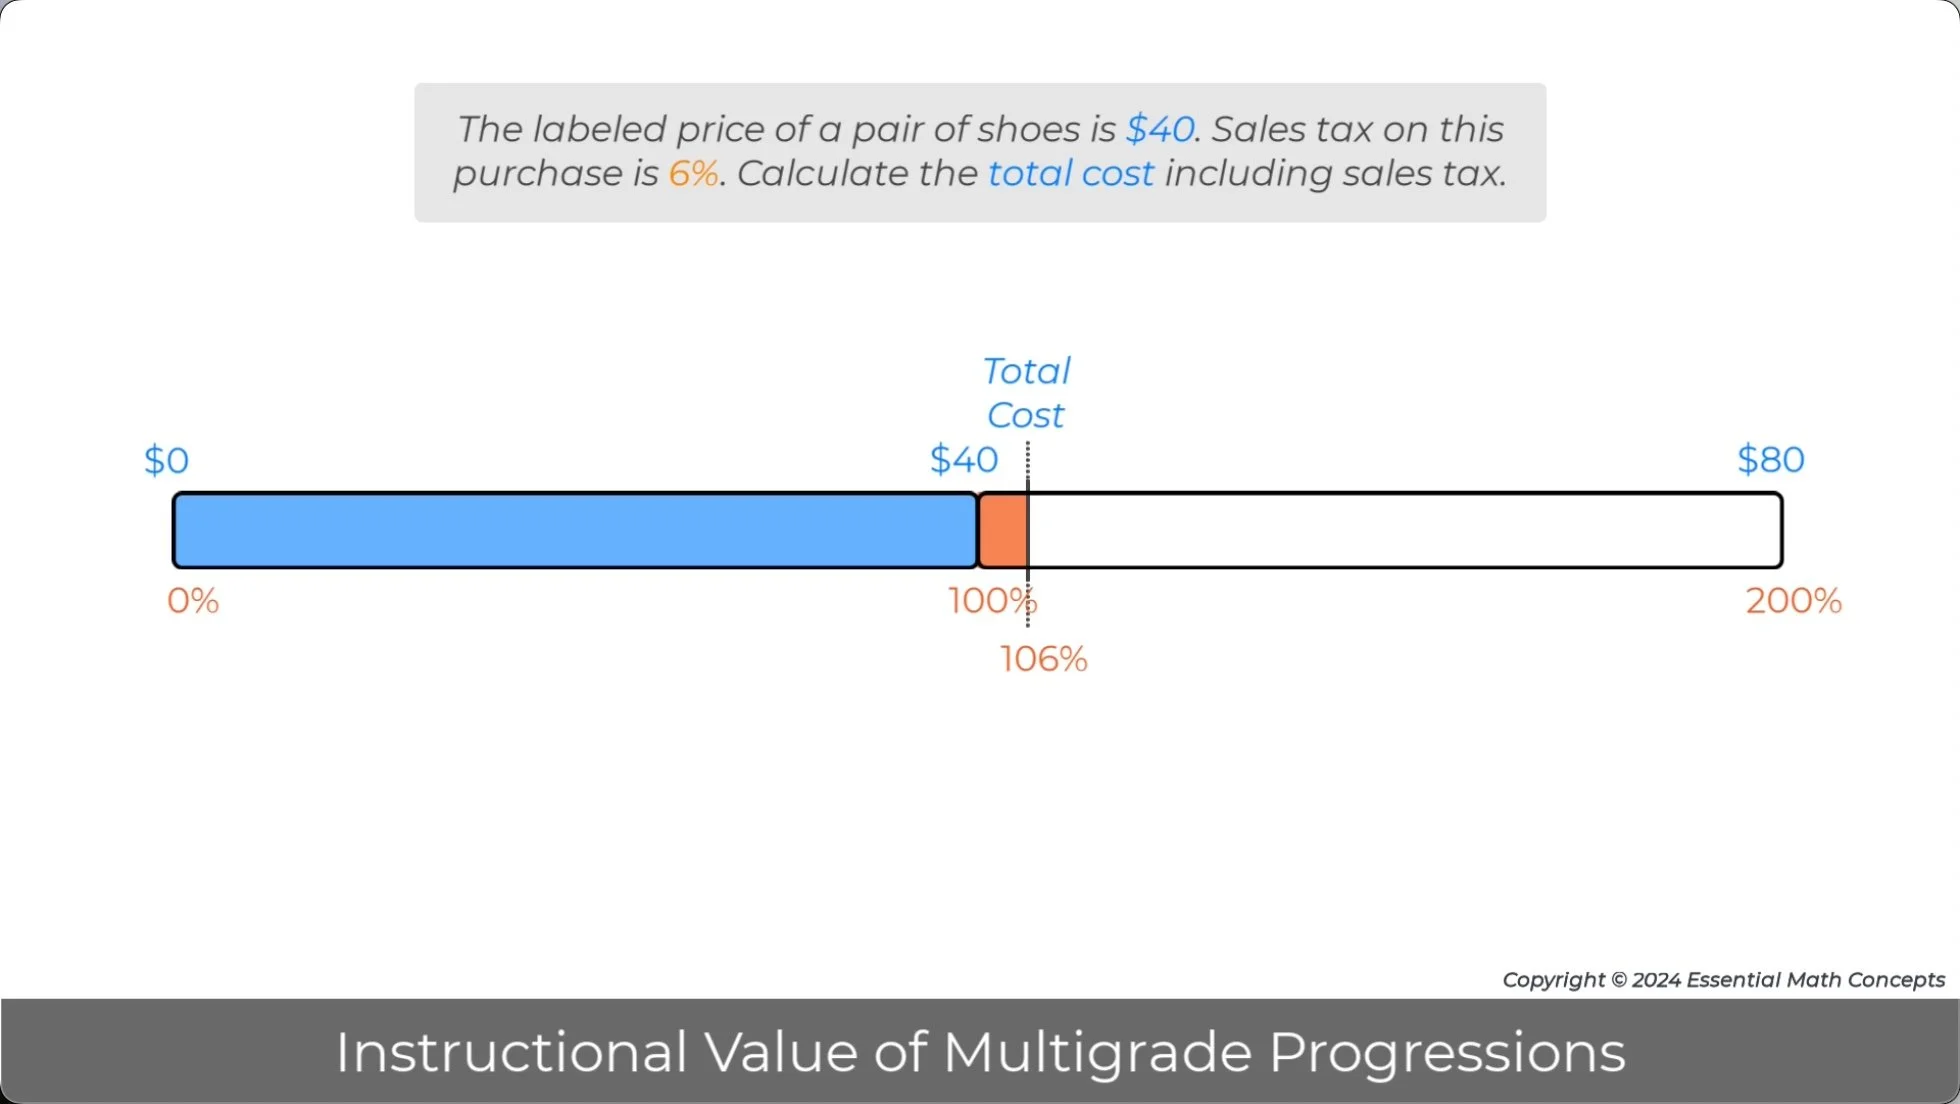
Image - Video Pause Point 1:55
In grade 7, transitional strategies from grade 6 are used to help students solve problems involving friendly numbers.
Identify the different ratio table strategies used to generate each equivalent ratio in the table.
Discuss the idea of what constitutes a “friendly” set of numbers in a problem.
11.
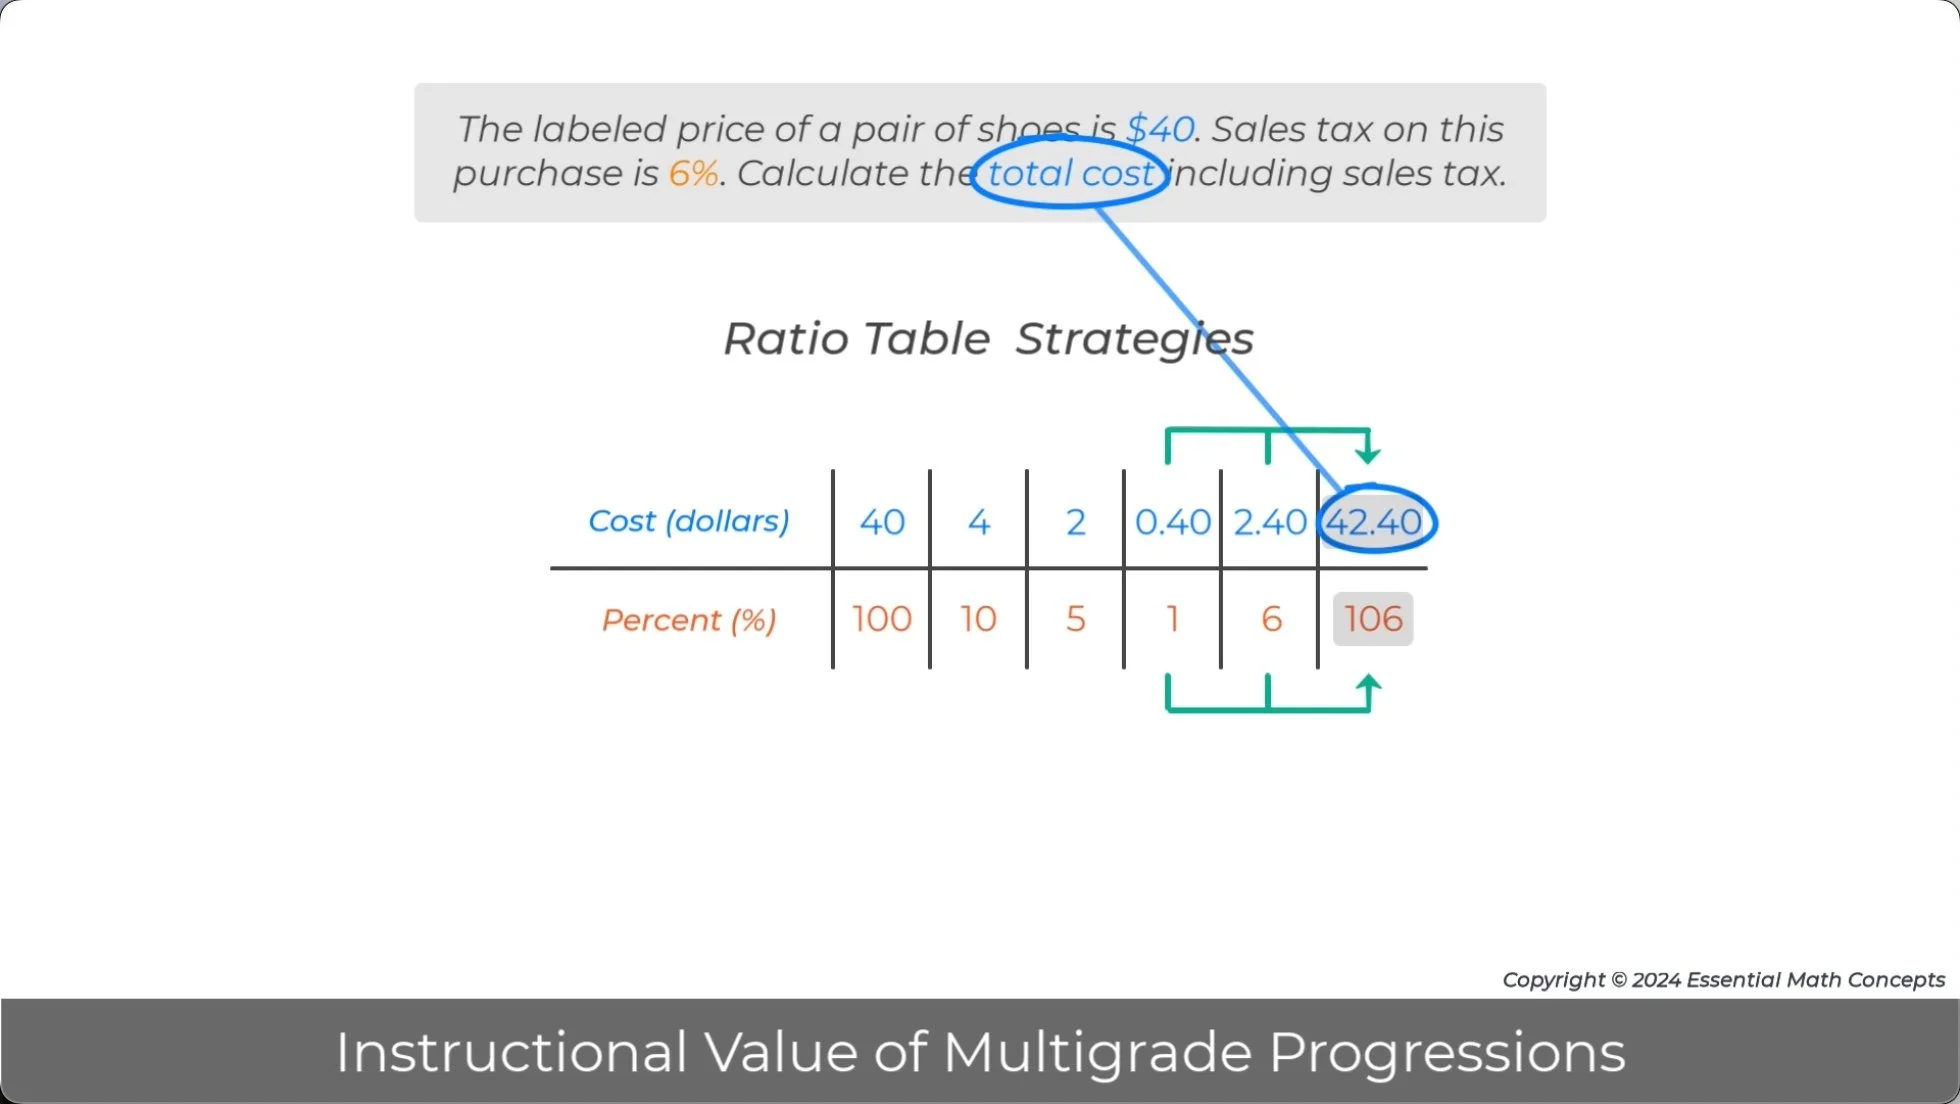
Image - Video Pause Point 2:00
In grade 7, formal multiplier strategies from grade 6 will be repeatedly applied to solve problems. In the percent problem below, the external ratio multiplier was calculated to find 106% of $40.
Discuss how a multiplier equation could have been written and solved to calculate this multiplier. Then, write and solve a multiplier equation for the internal ratio multiplier for this problem.
12.

Image - Video Pause Point 2:04
Ratio tables are used to organize and calculate multipliers for multiple topics in grade 7.
Discuss how multiplier strategies, that were introduced in grade 6, are applied to solve problems involving scaled figures, random samples, probability, and radius-circumference problems.
13.
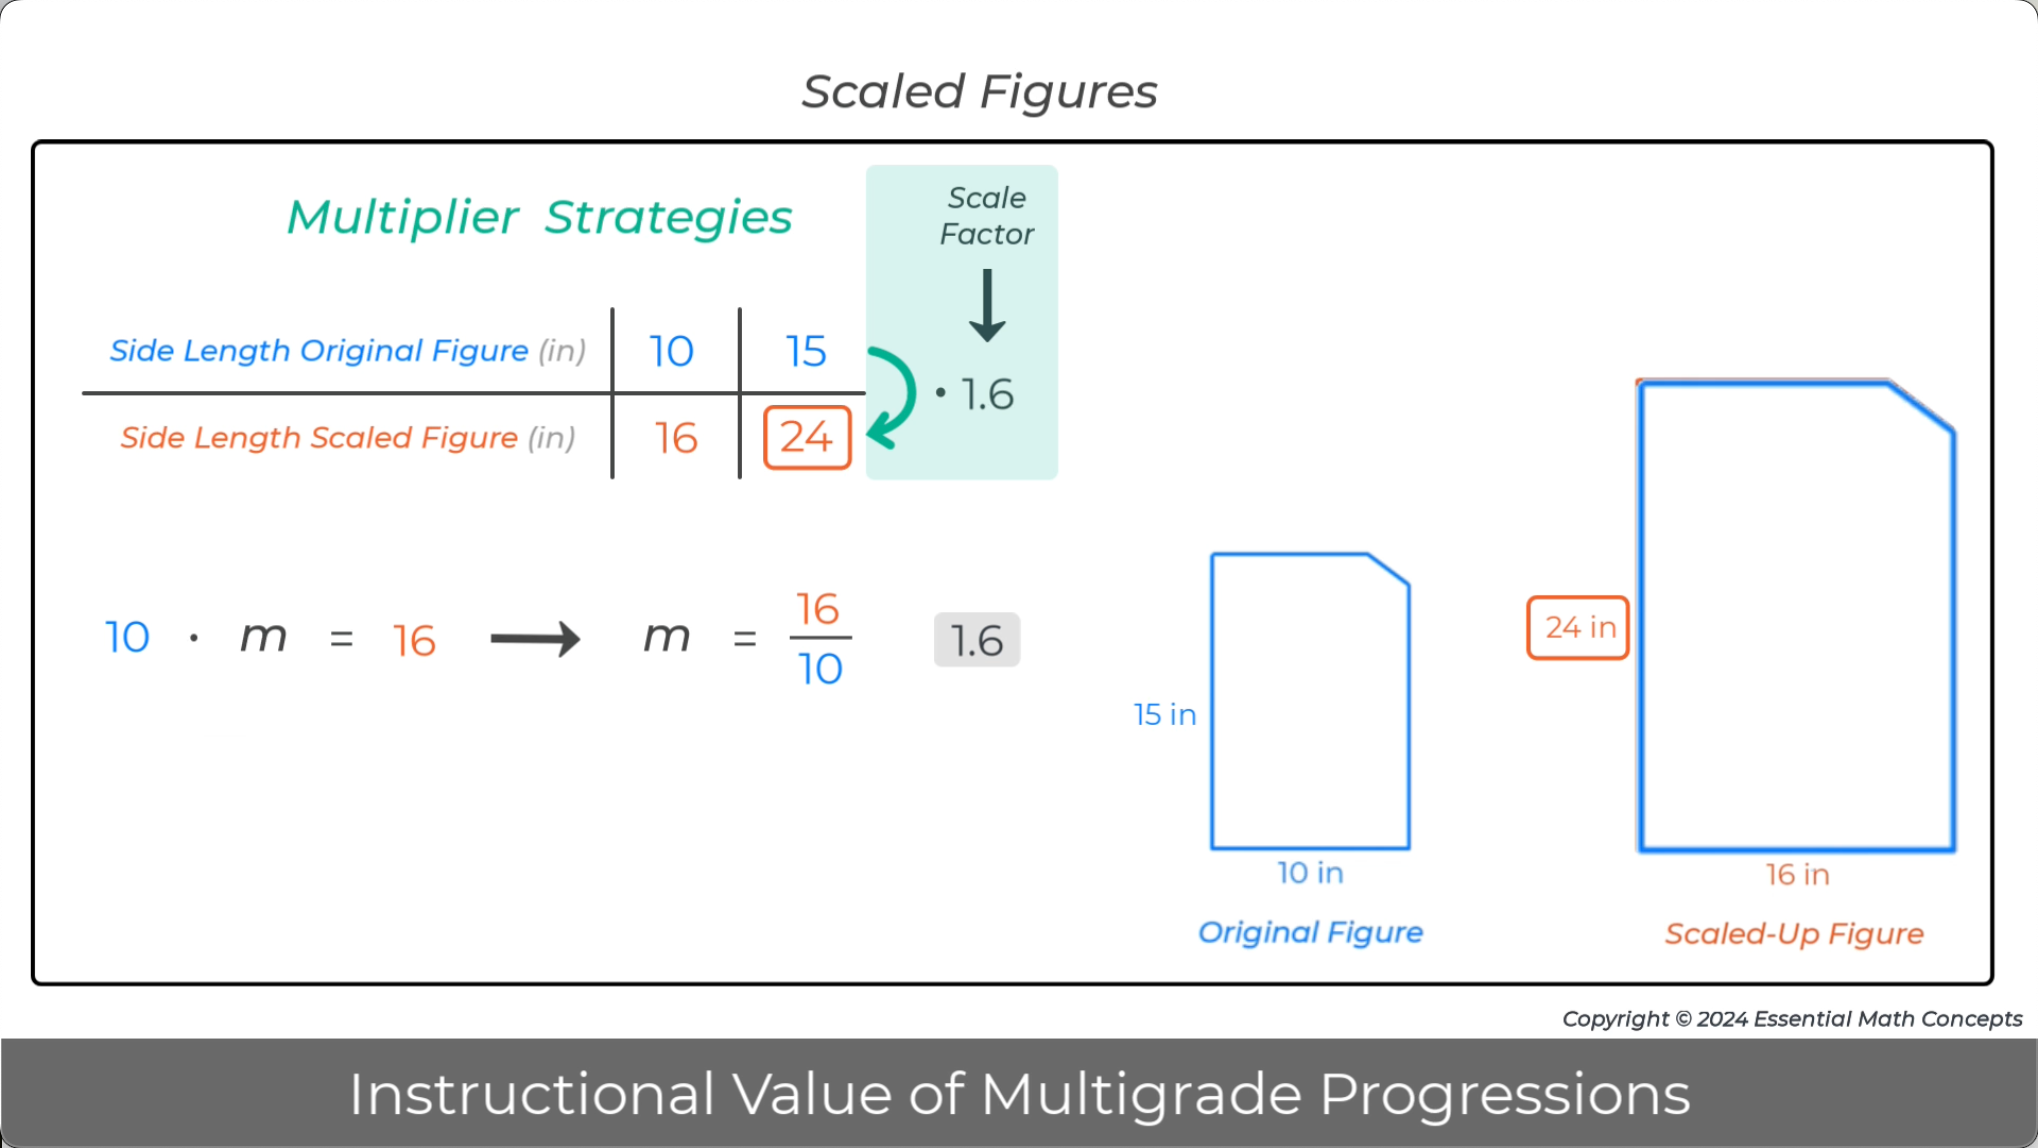
Image - Video Pause Point 2:06
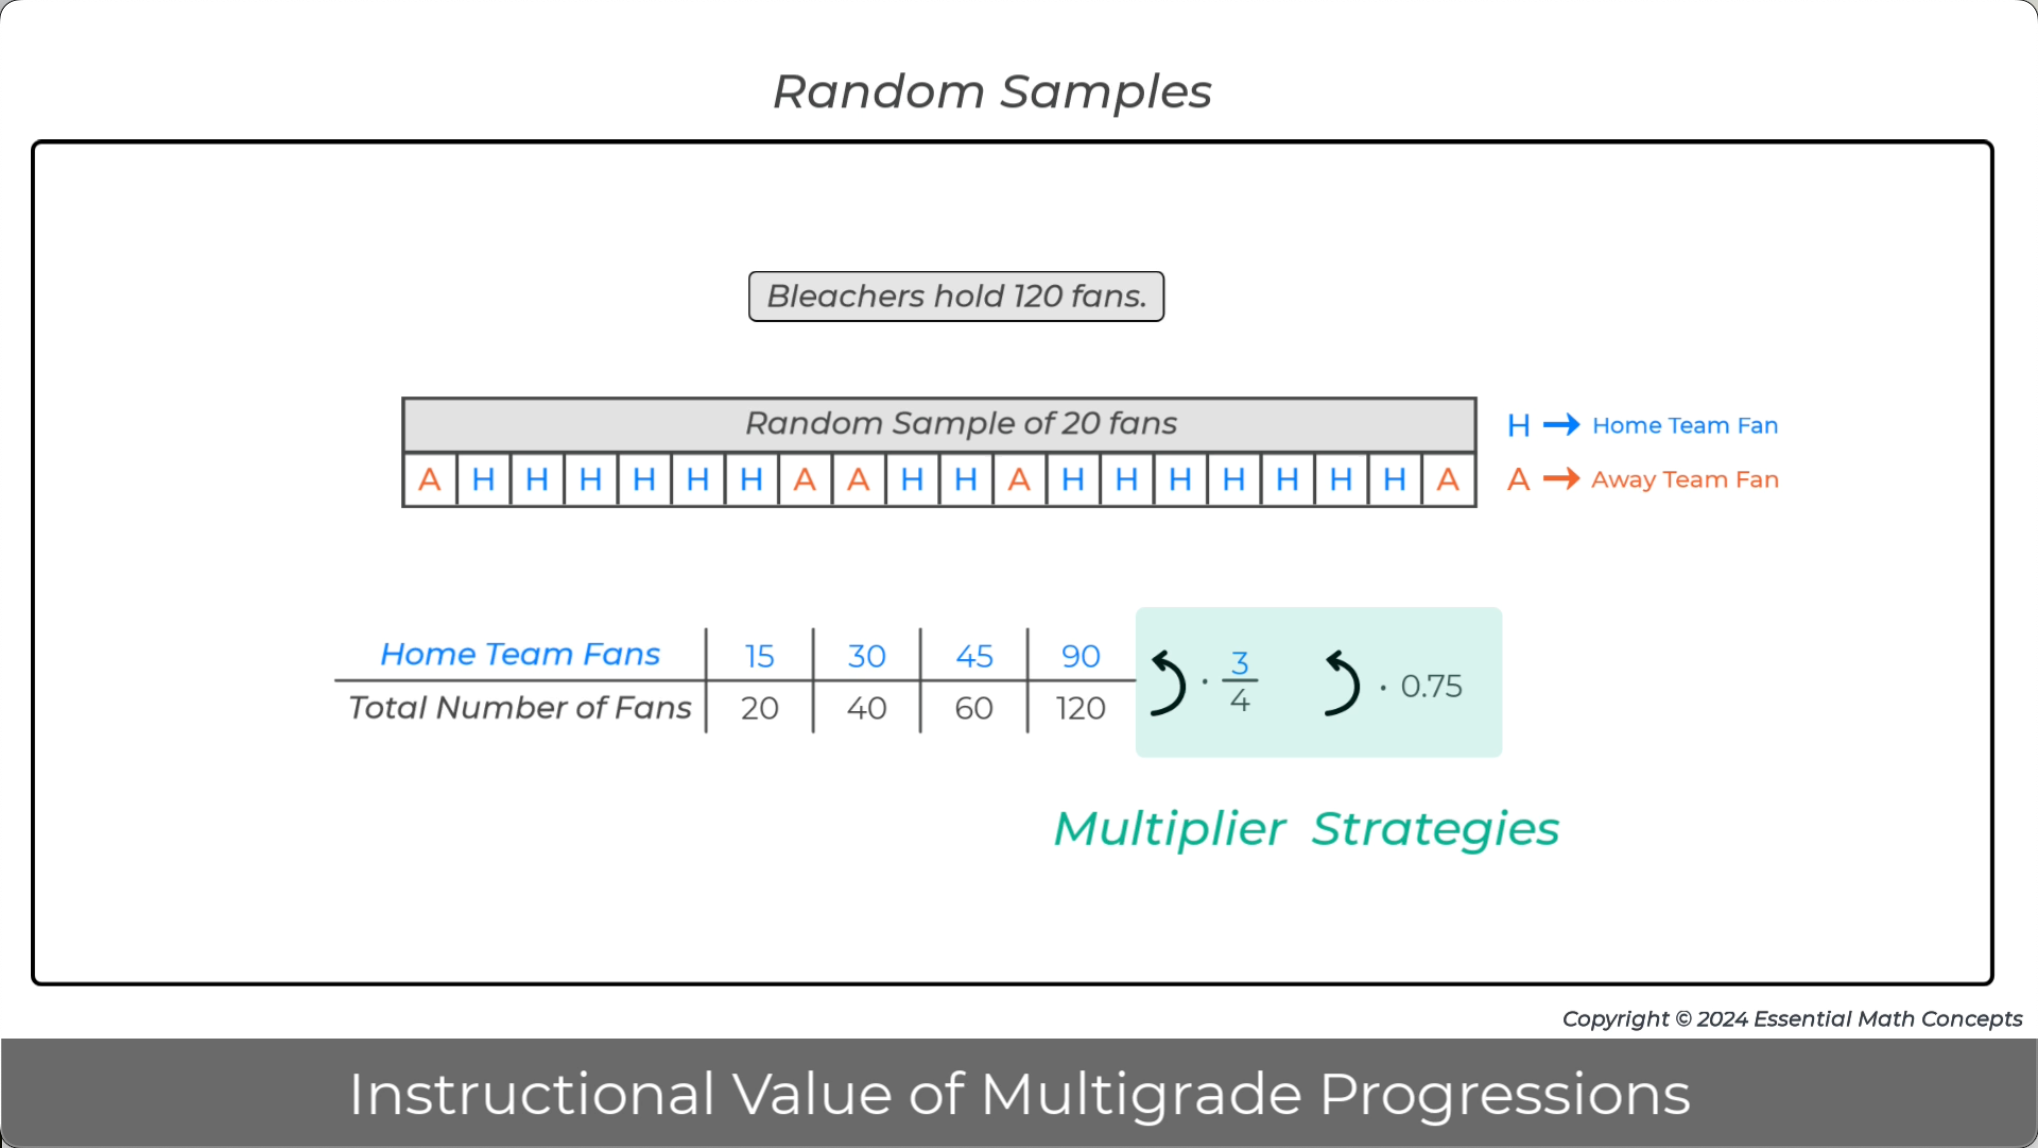
Image - Video Pause Point 2:07
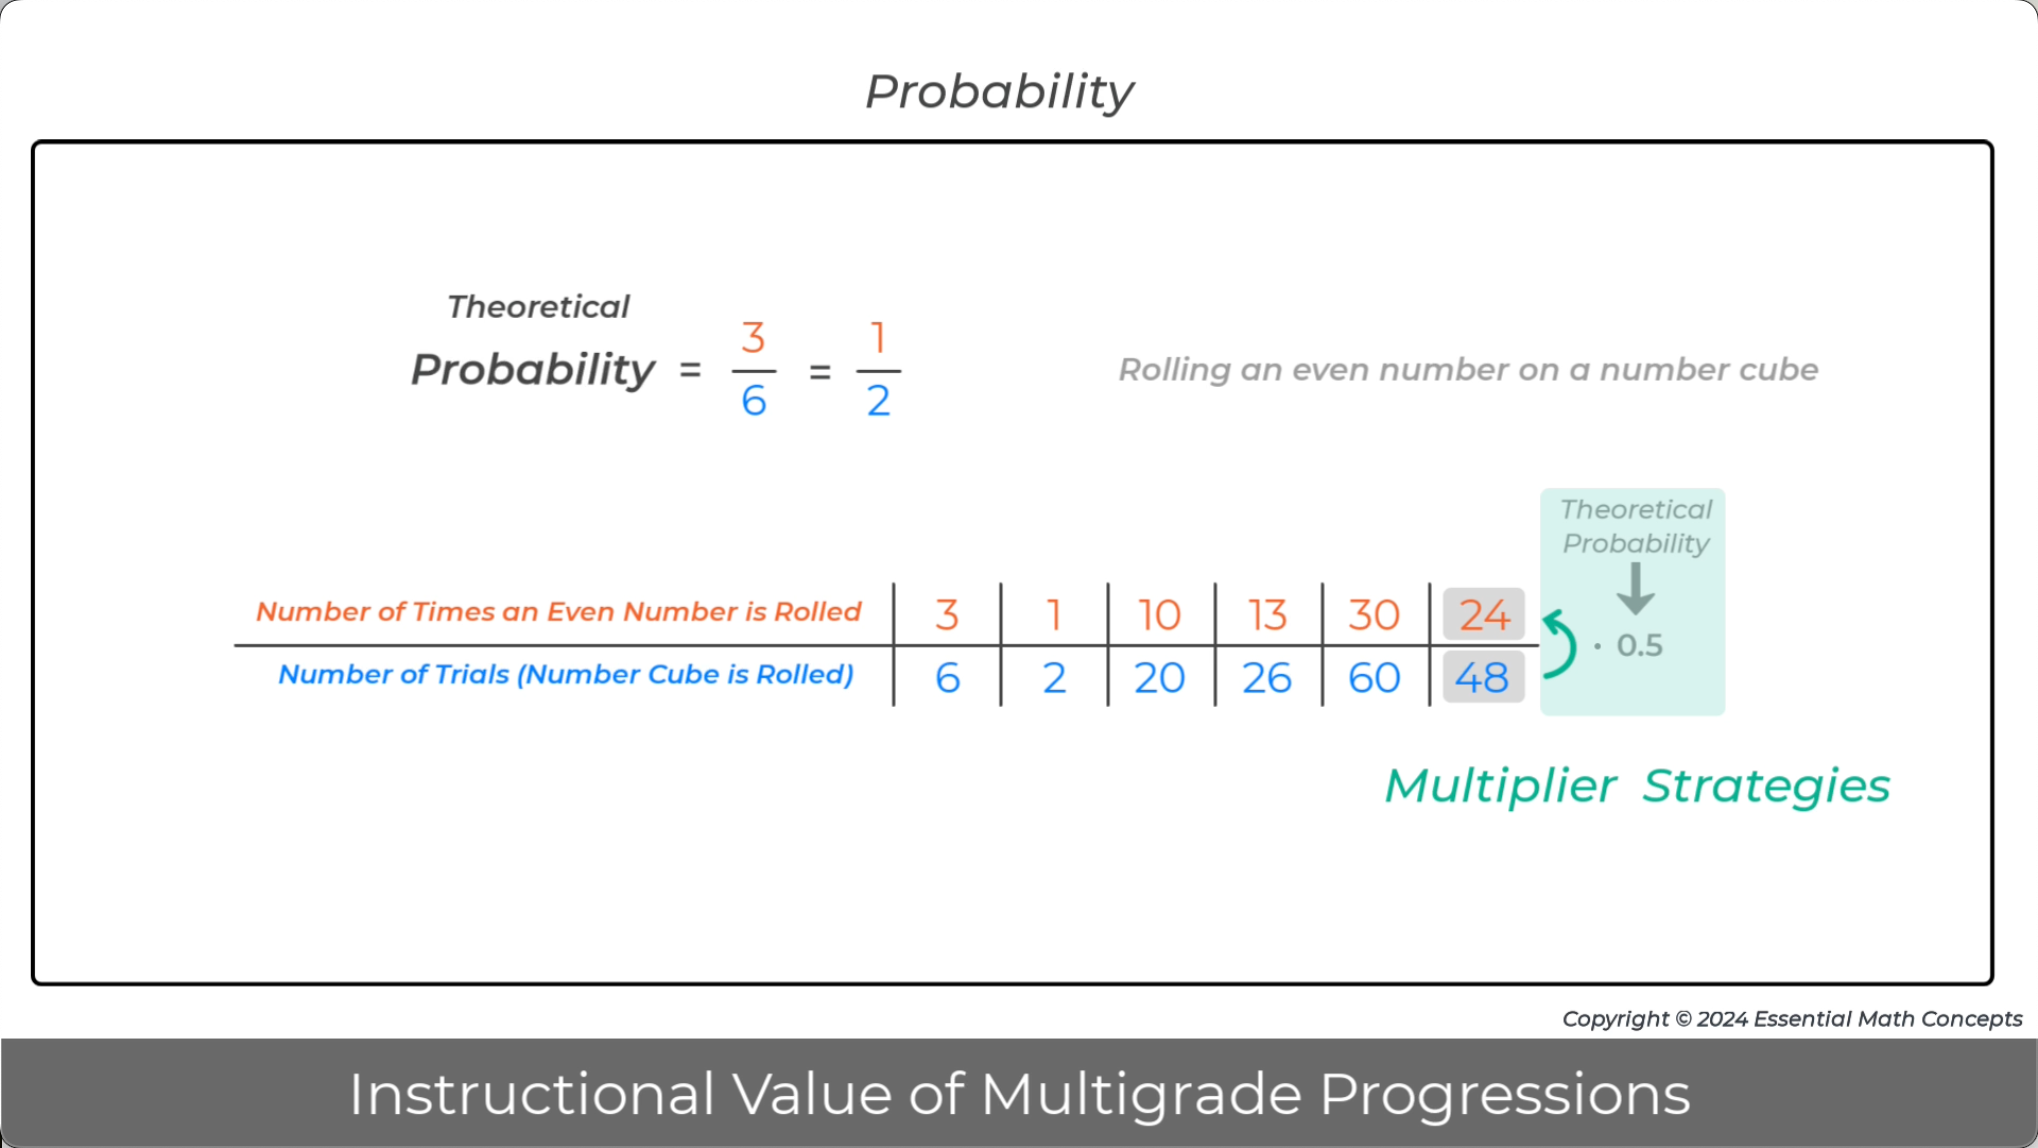
Image - Video Pause Point 2:08

Image - Video Pause Point 2:11
In grade 7, equivalent ratios in a ratio table are identified as satisfying a proportional relationship. Then, the internal ratio multiplier for a set of equivalent ratios is calculated and identified as the constant of proportionality. Finally, algebraic variables are used to represent quantities in the ratio table and substituted in the multiplier equation to generate an algebraic equation for the proportional relationship.
Discuss how working with ratio tables and multipliers in grade 6 prepares students to better understand the transition to algebraic representations in grade 7.
14.

Image - Video Pause Point 2:18
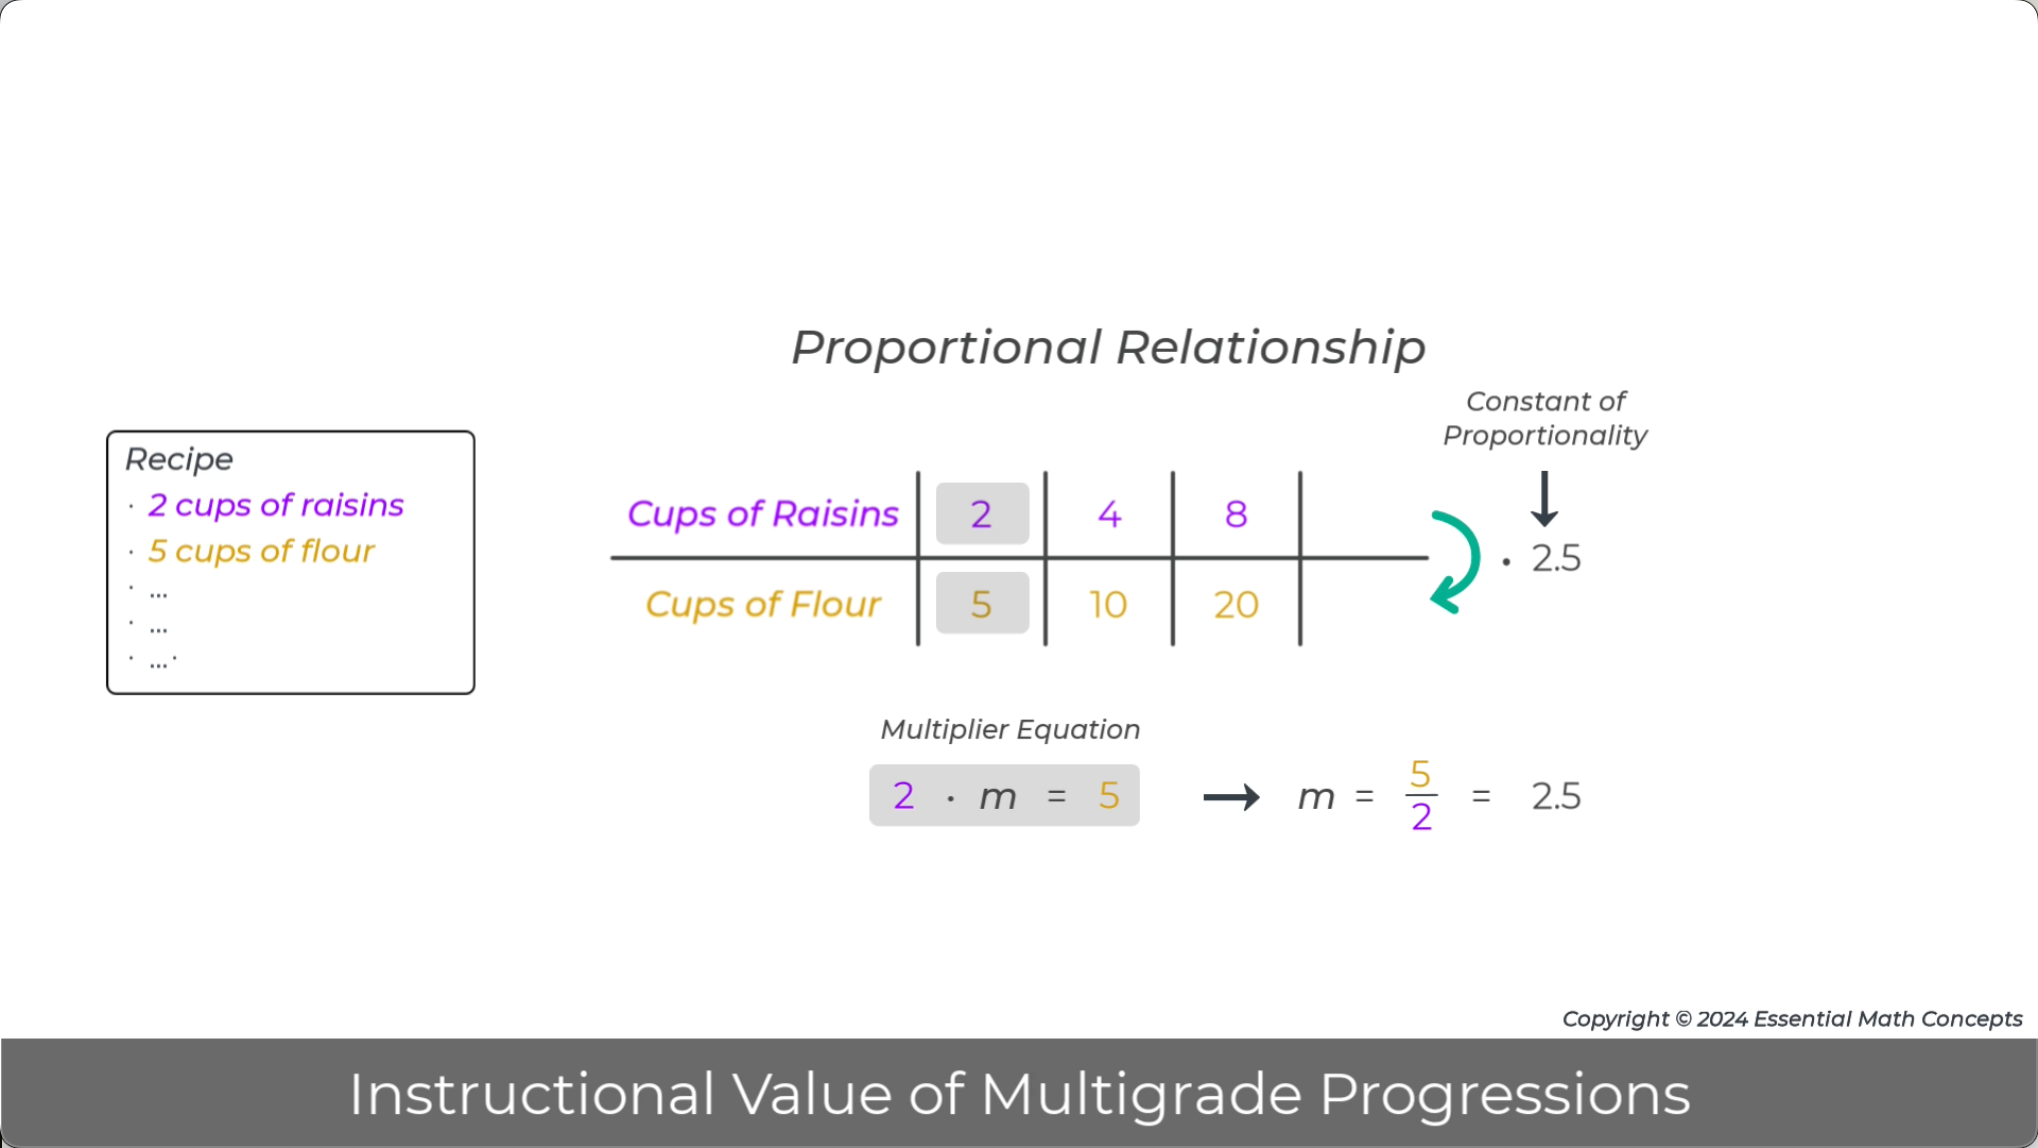
Image - Video Pause Point 2:24
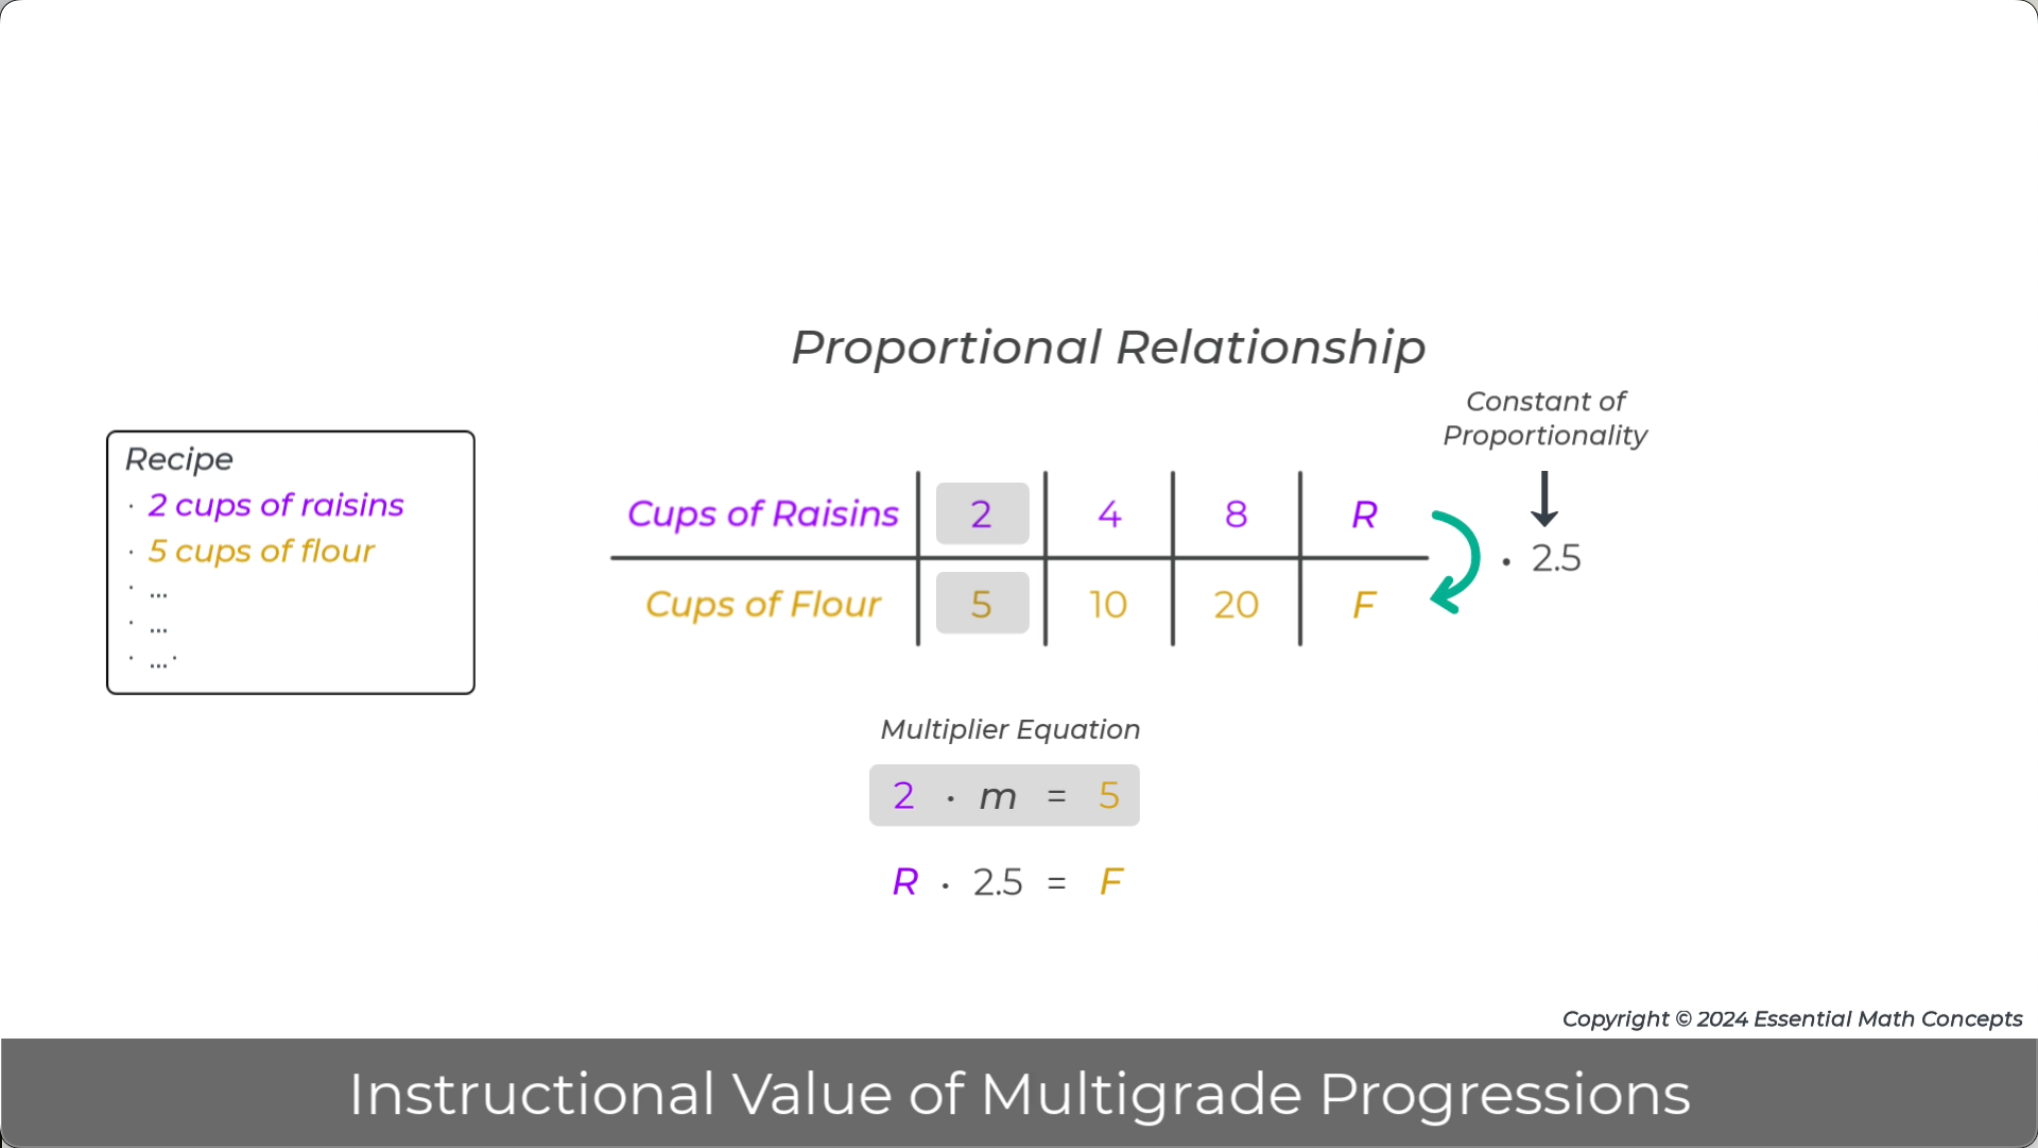
Image - Video Pause Point 2:26
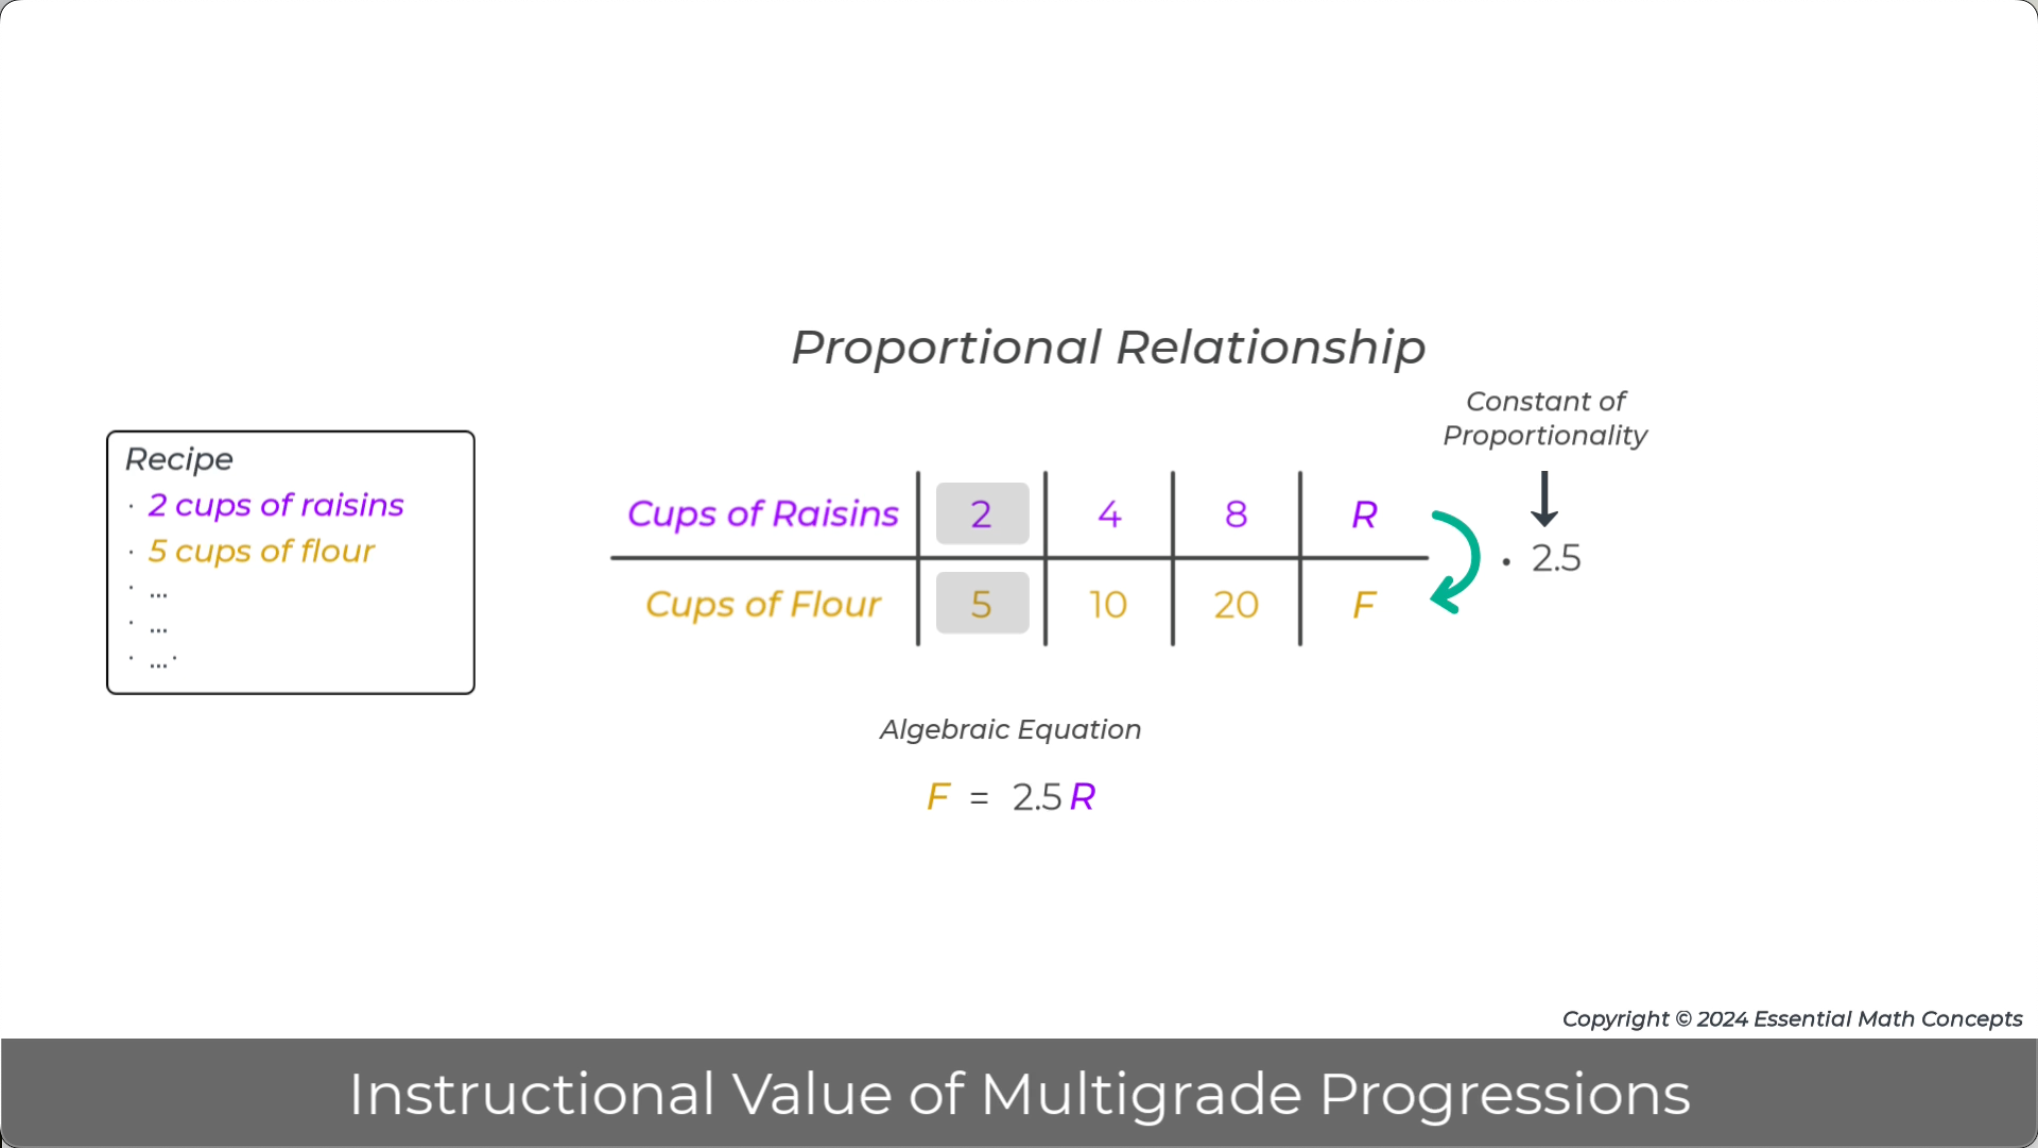
Image - Video Pause Point 2:30
The equivalent rates in the horizontal ratio table can be reorganized in a vertical algebraic table of ordered pairs. The order pairs representing each equivalent rate can be graphed to form a line that represents the proportional relationship.
Discuss the relationship between points on the line and the algebraic equation and table. Include the constant of proportionality and variable type (independent and dependent) in this discussion.
15.
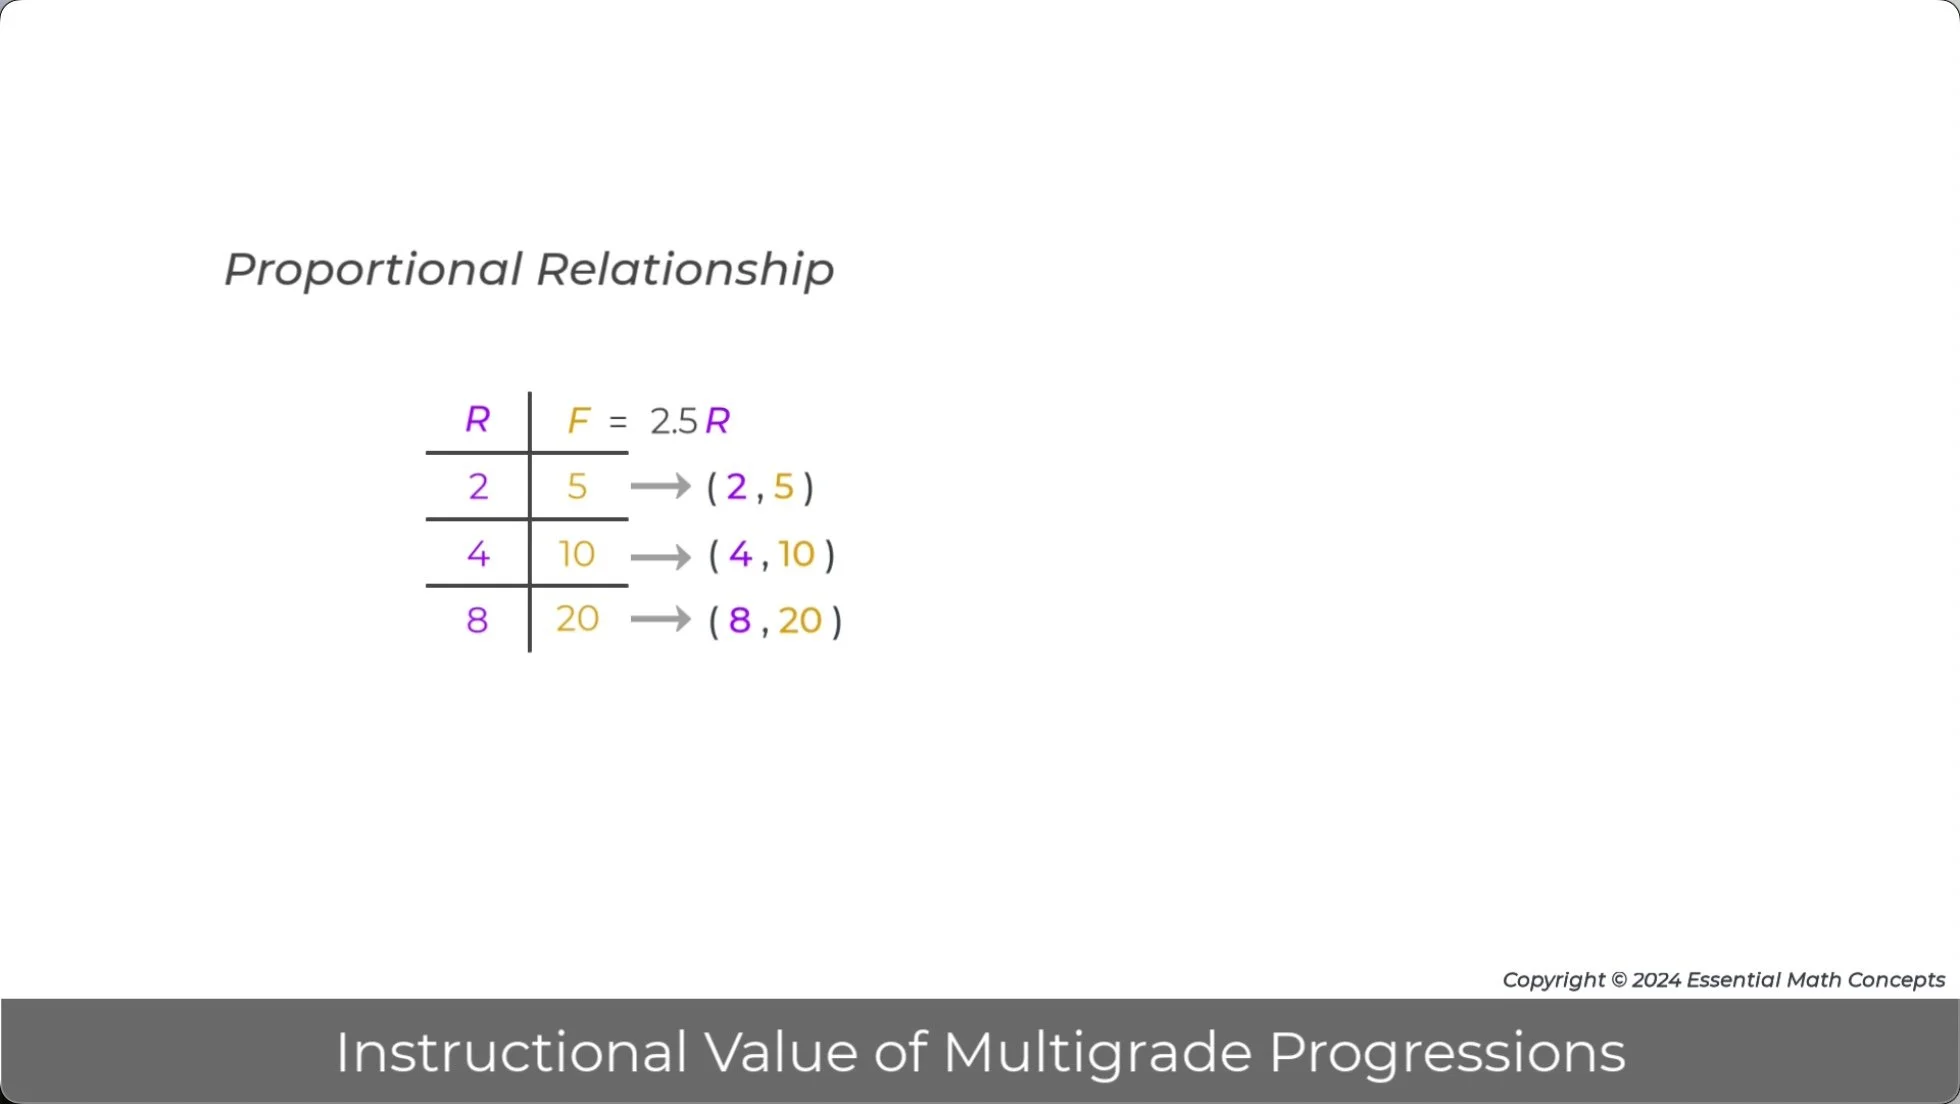
Image - Video Pause Point 2:35

Image - Video Pause Point 2:40
Grade 8
In grade 8, the internal and external ratio multipliers introduced in grade 6 are applied to identify and apply the two different ratio relationships for the side lengths of similar triangles. One equivalent ratio relationship exists between the ratio of corresponding sides in two similar triangles. The other equivalent ratio relationship exists between the ratio of side lengths within each similar triangle, such as the ratio of the length of the vertical leg to the length of the horizontal leg.
Discuss how students’ experience with both types of ratio multipliers in grades 6 and 7 prepares them to recognize the two different ratio relationships in similar triangles.
Identify the two ways to use ratio tables to organize the ratio of side lengths in similar triangles.
16.
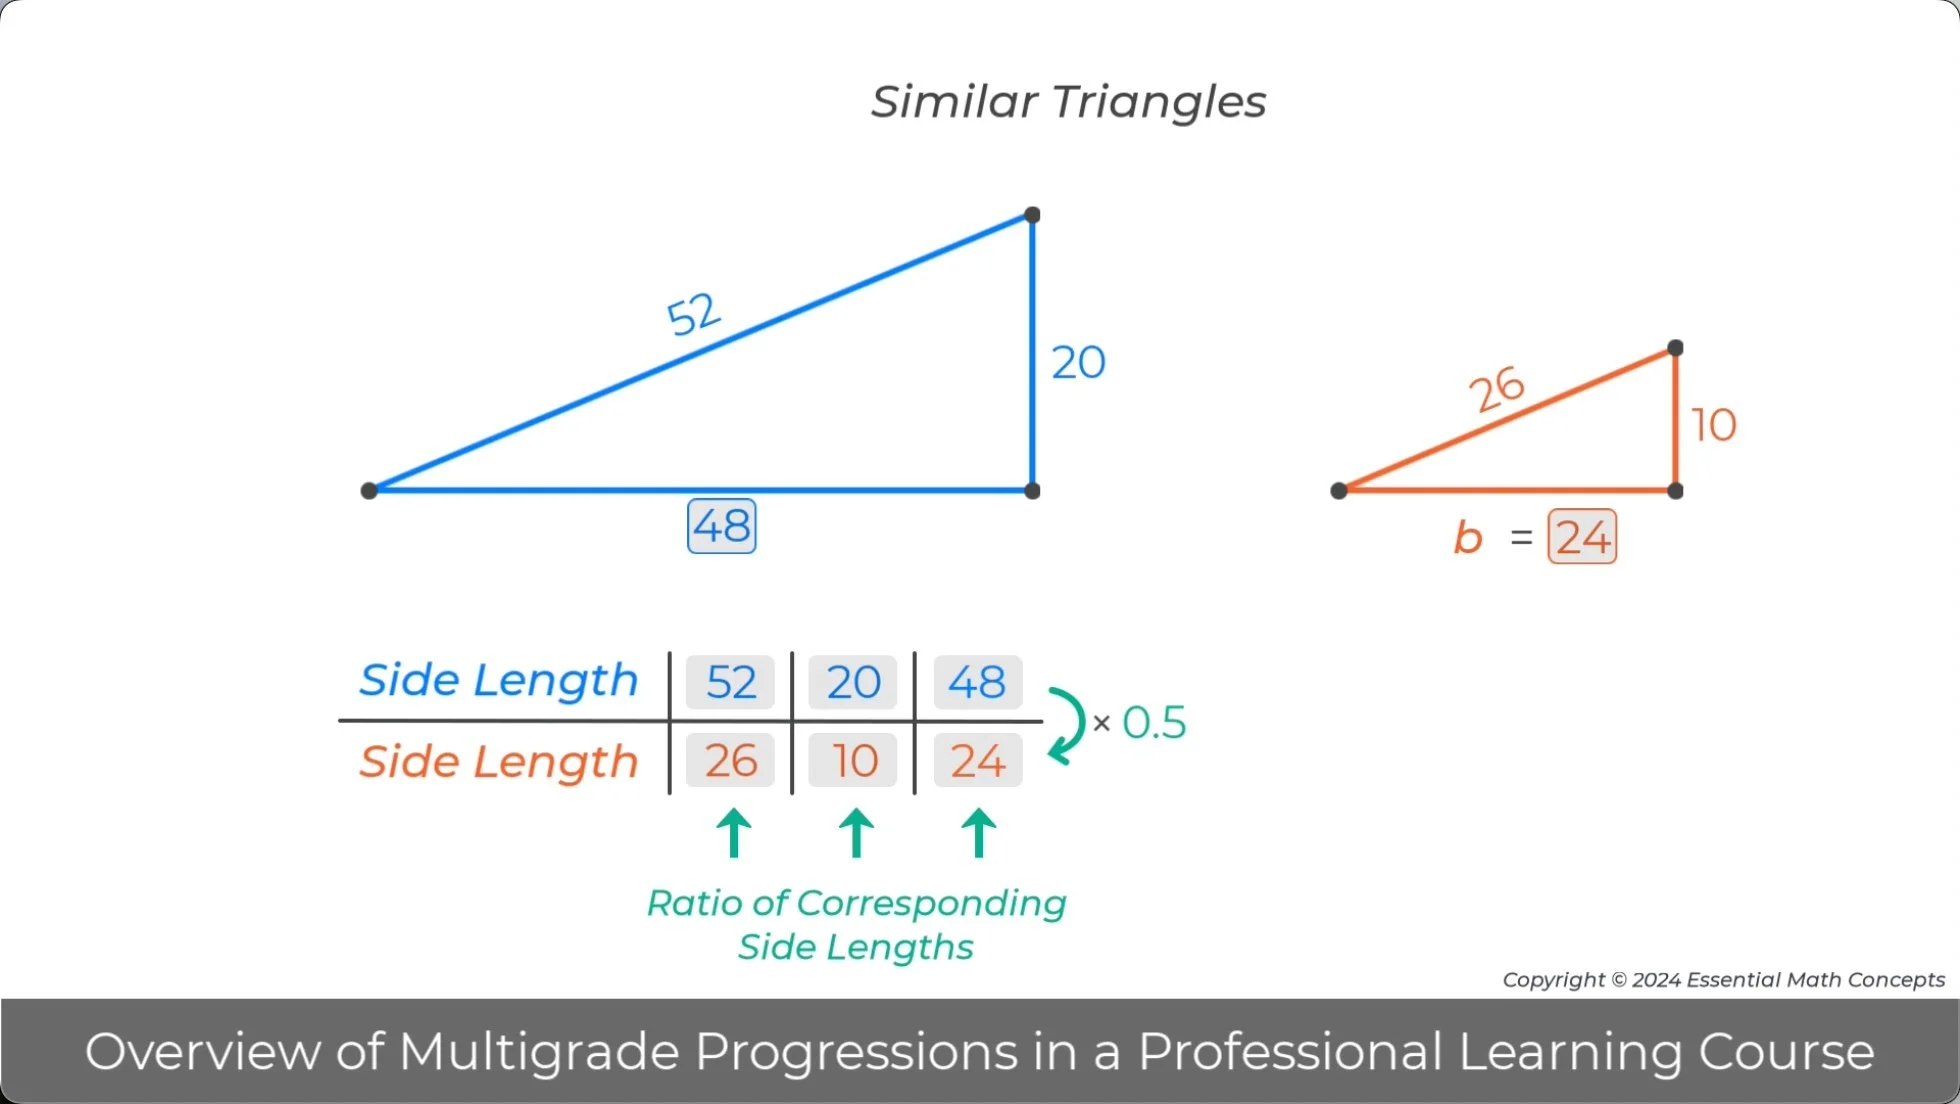
Image - Video Pause Point 2:51
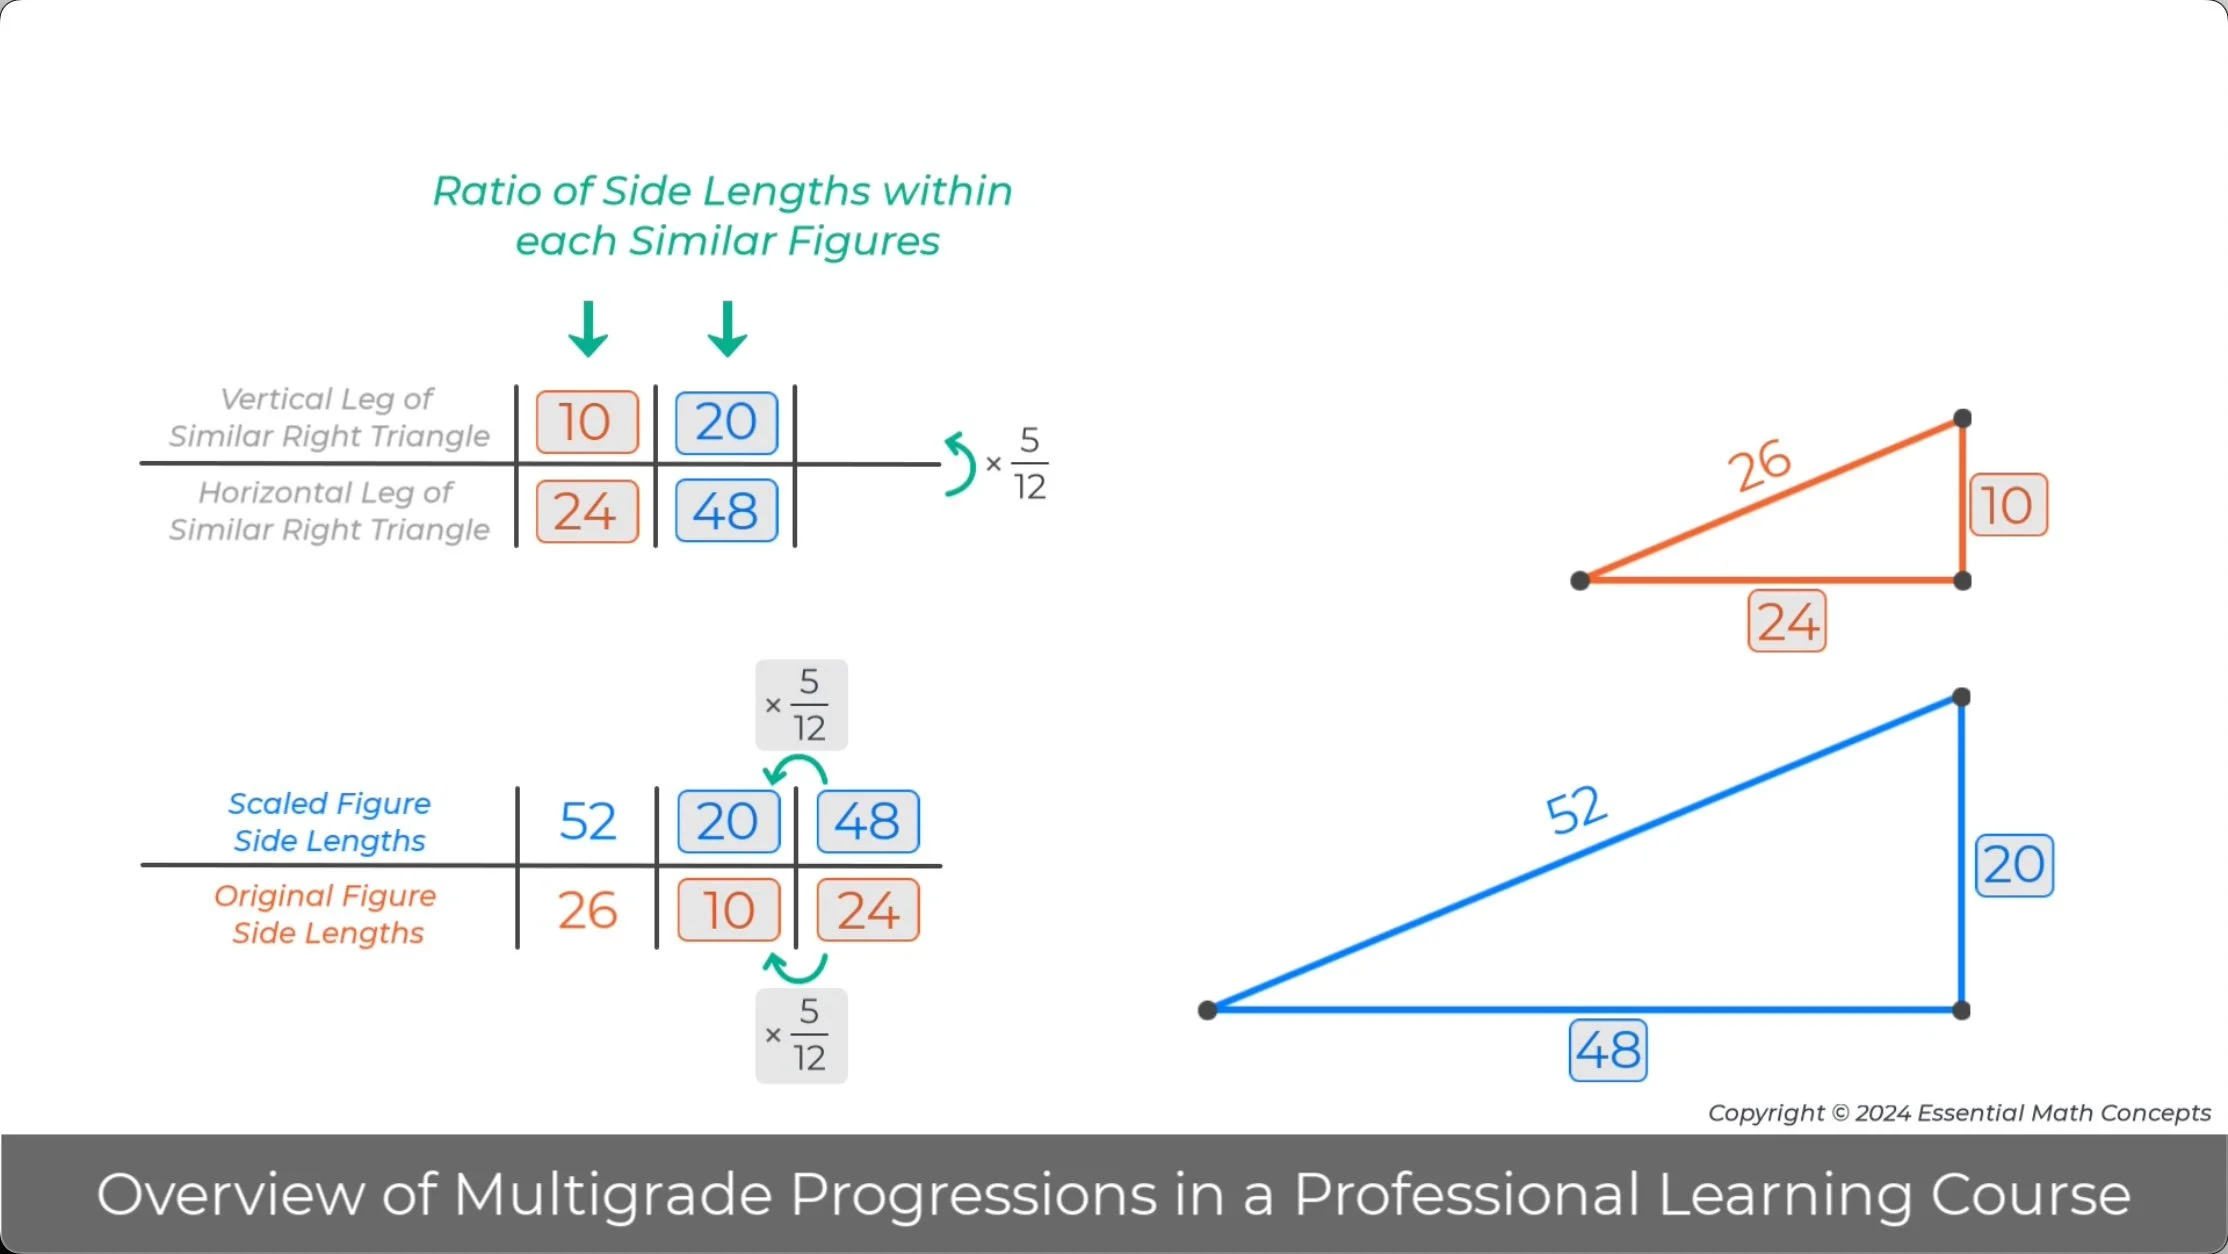
Image - Video Pause Point 2:54
Both ratio multiplier relationships are applied to generate right triangles that describe the slope of a line on a graph. When the ratio of vertical to horizontal side lengths is organized in a ratio table the internal ratio multiplier is the slope of a line formed by these right triangles.
Discuss how additional right triangles representing this slope can be generated in the ratio table and on the graph.
Explain how both types of ratio multipliers are used to define and identify the slope of a line on a graph.
17.
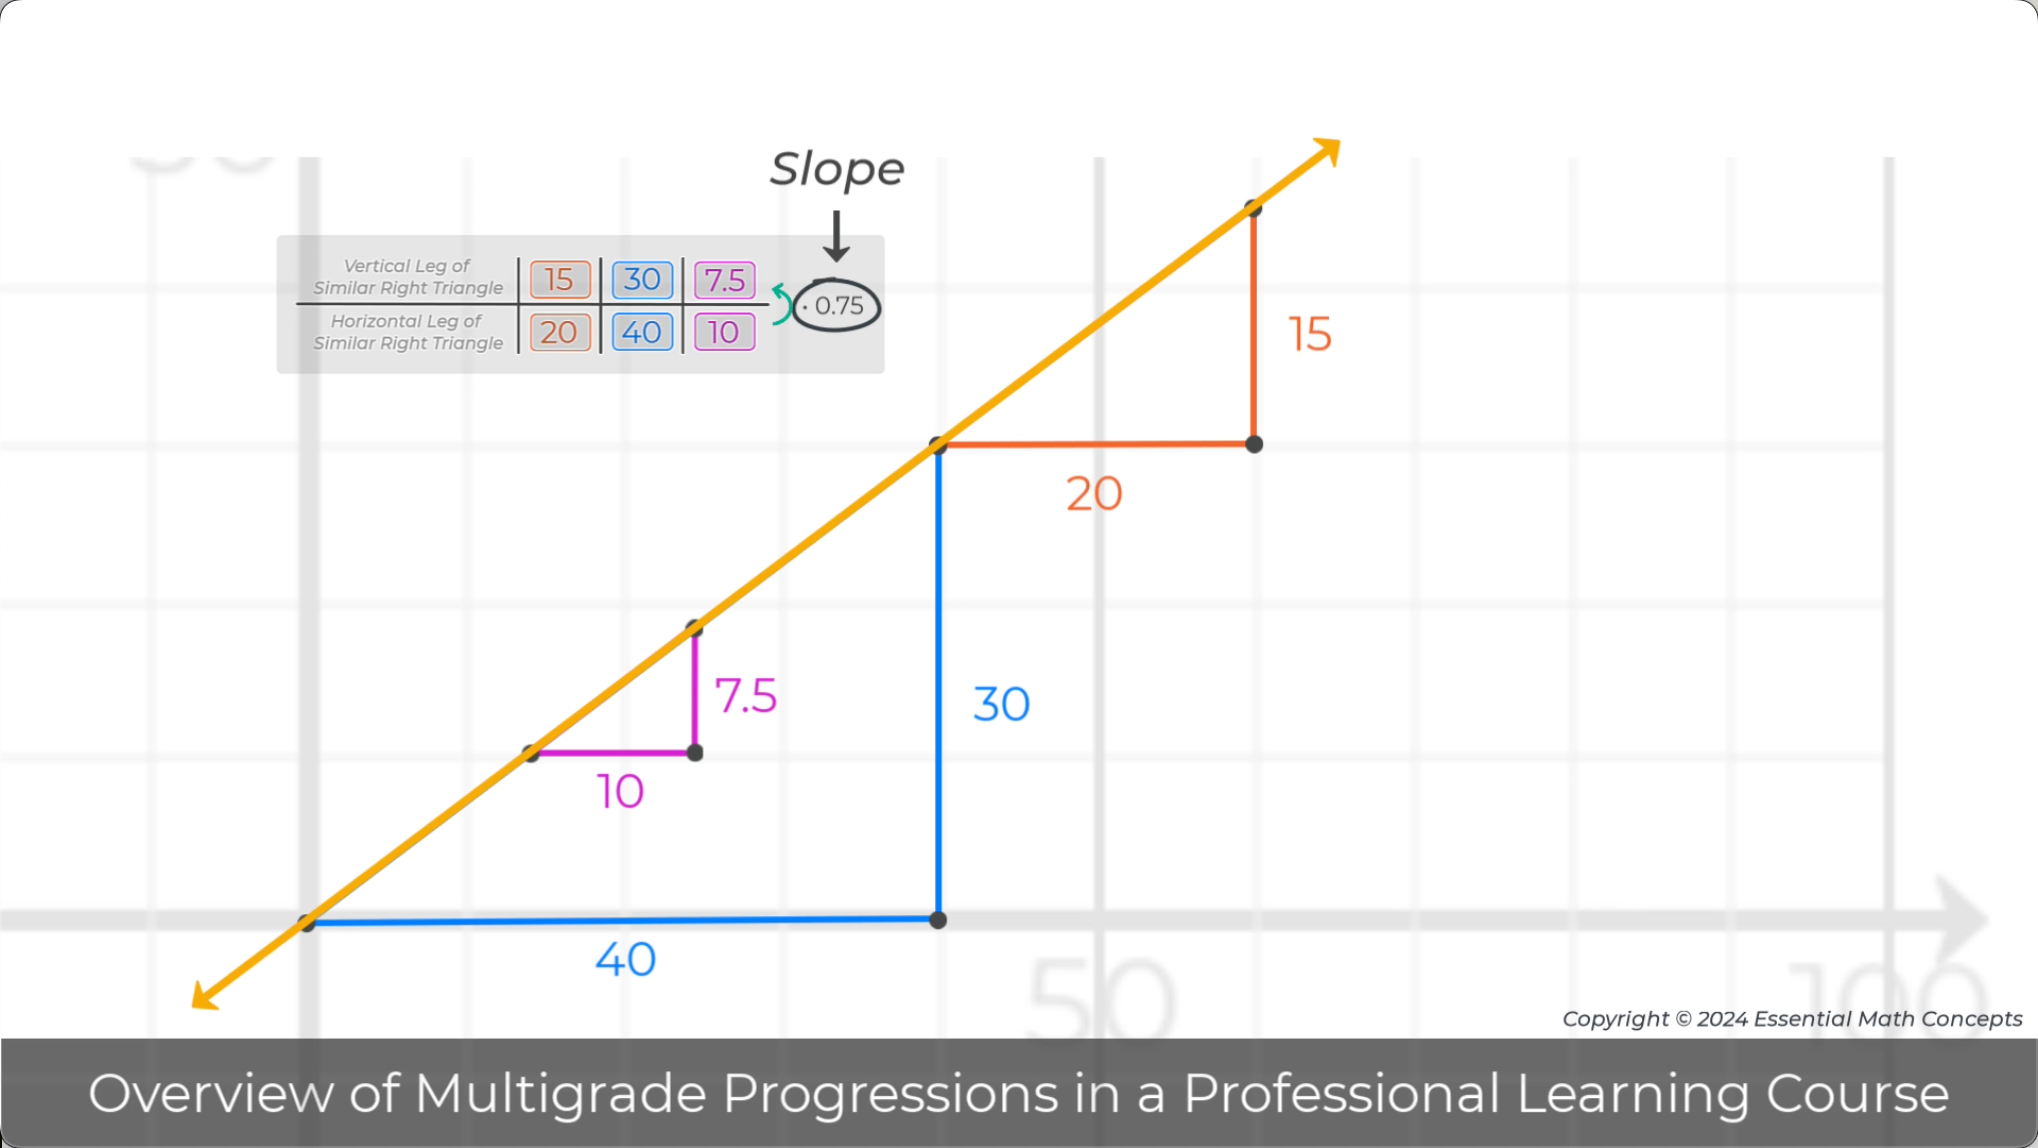
Image - Video Pause Point 2:59

Image - Video Pause Point 3:02
The process from the previous prompt can be reversed to calculate the slope of a line on a graph. In the previous prompt, the lengths of the vertical and horizontal legs of similar right triangles were generated in a ratio table. In the table below, similar right triangles formed by a line on a graph are used to identify equivalent slope ratios.
Discuss how grade 6 and 7 strategies are applied to calculate the slope multiplier for these equivalent slope ratios.
18.

Image - Video Pause Point 3:10
The ratio table and multiplier strategies introduced in grade 6 are applied to many different contexts in grades 7 and 8. In each problem below, the ratio tables organize the given values in the problem and structure the multiplier calculations.
Discuss how helping teachers understand this progression will them to challenge students to better understand essential ratio and proportional concepts and apply those concepts to solve problems at each grade level.
19.

Image - Video Pause Point 4:04