
PLC Video
Grade 7 — Proportional Relationships
EMC 2 — Write Equations for Proportional Relationships
PL Video Objectives
Explore how students can apply grade 6 multiplier equations for ratio tables to write algebraic equations for a proportional relationship.
Explore how students can apply a unit rate in a problem to write an equation for a proportional relationship.
Implementation Recommendations
PLC Prompts 1-3 can be implemented at a single professional learning team meeting.
PLC Prompts 4-7 can be implemented at a single professional learning team meeting.
PLC Questions and Prompts
In grade 6, students generated sets of equivalent ratios and rates and wrote and solved a multiplier equation to calculate the internal ratio multiplier. In grade 7, students use algebraic variables to represent the quantities in the table for the proportional relationship.
Review how students can calculate the constant of proportionality by writing and solving a multiplier equation.
Discuss how the algebraic variables and the grade 6 multiplier equations can be used to write an algebraic equation for the proportional relationship.
1.

Image - Video Pause Point 0:48

Image - Video Pause Point 0:59

Image - Video Pause Point 1:04
The algebraic equation for a proportional relationship represents all of the equivalent ratios that can be generated by applying the constant of proportionality.
Discuss how students can use the algebraic equation for a proportional relationship to determine if a ratio or rate satisfies the proportional relationship.
2.

Image - Video Pause Point 1:13
The algebraic equation for a proportional relationship can be used to solve ratio and rate problems.
In the first problem, there are 10 cups of raisins. Review how the table and equation are used to calculate the number of cups of flour.
In the second problem, there are 7.5 cups of flour. Review how the table and equation are used to calculate the number of cups of raisins.
Discuss how these algebraic equation strategies mirror the multiplier strategies from grade 6.
3.

Image - Video Pause Point 1:25
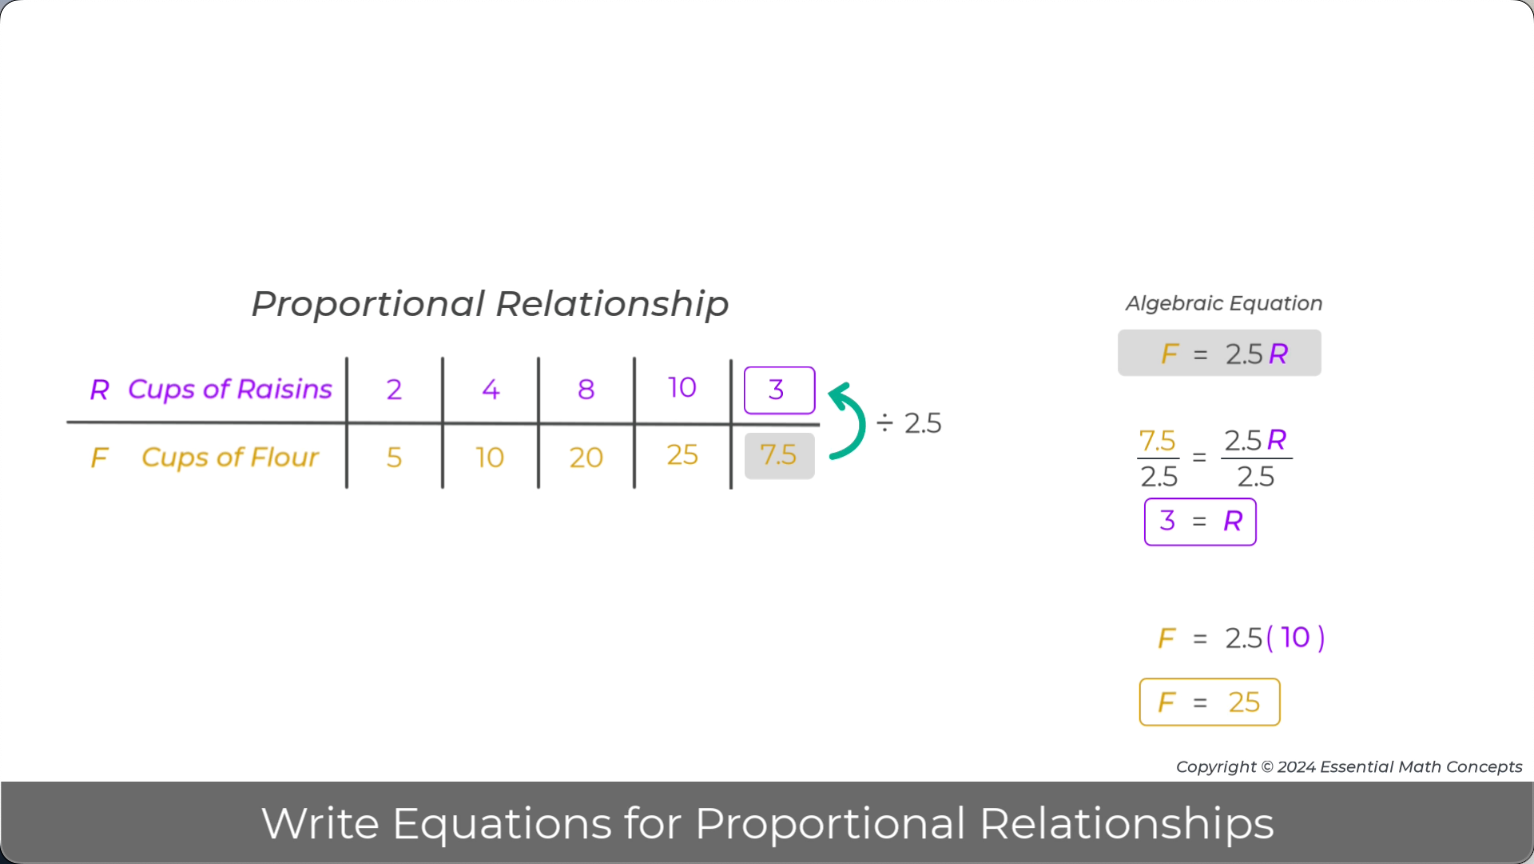
Image - Video Pause Point 1:40

Image - Video Pause Point 1:53
For Prompts 1-3, an equation was written for a set of equivalent ratios in a table by calculating the constant of proportionality for the ratios in the table and using it to write the equation.
For the remaining prompts for this PLC Video, the unit rate in a problem is used to generate the values in a table and write an equation for a proportional relationship.
Discuss how these two different approaches to writing an algebraic equation for a proportional relationship are similar and different.
4.

Image - Video Pause Point 2:02
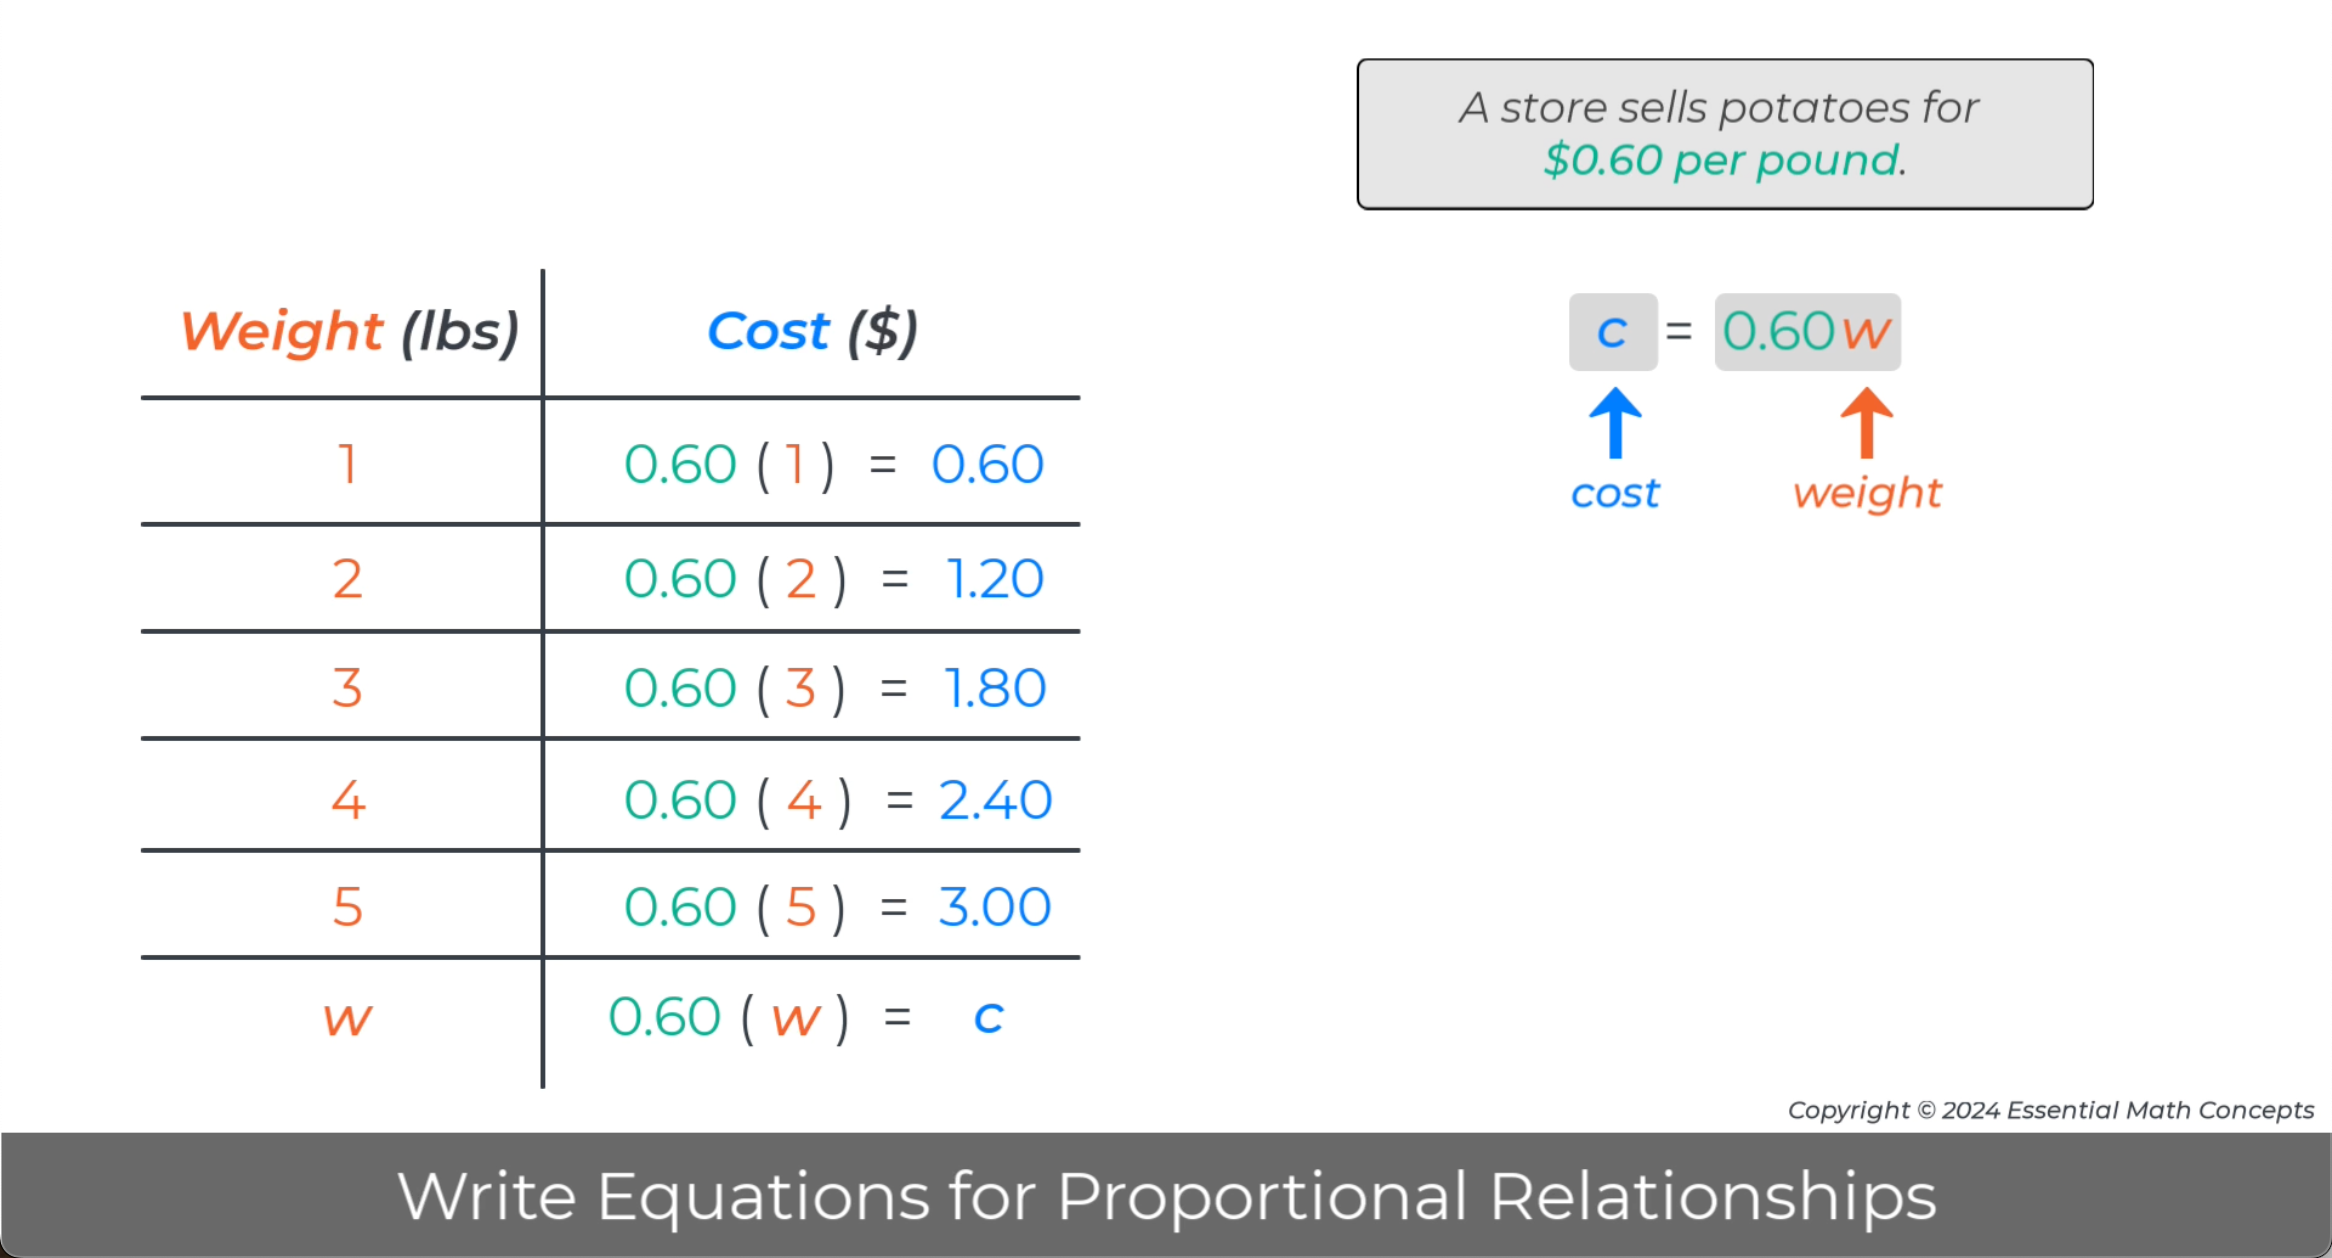
Image - Video Pause Point 2:24
The values in this table of order pairs were generated by substituting a weight in potatoes into a series of numeric equations to calculate the cost of the potatoes.
Discuss how this approach to generating the values in an algebraic table can help students make sense of the terms independent and dependent variables.
5.

Image - Video Pause Point 2:43
When the unit rate for a proportional problem is given in a problem, an equation can be written without building an algebraic table. However, building just a few rows of an algebraic table can help students to check that their equation is correct.
Discuss how students can use the ratio multiplier in the table to double-check the structure of the algebraic equation. For example, students may mistakenly write the equation w = 0.60c if they are just focused on a procedure for writing the equation when given the unit rate.
Discuss how students can use the ordered pairs in the table to double-check the structure of the algebraic equation.
6.

Image - Video Pause Point 3:02
Subsequent PLC Videos will introduce graphing a proportional relationship and address how an algebraic equation can be written from the line representing the proportional relationship.
Discuss how students will identify the constant of proportionality from the graph of the proportional relationship.
7.

Image - Video Pause Point 3:23
Technical Details
Independent and Dependent Variables in Proportional Relationships
In grade 7, students start the transition to algebraic representations for ratios and rates. For example, ratio tables transition to algebraic tables or tables of ordered pairs when algebraic variables are used as row headings in a horizontal table and column headings in a vertical table.
As part of this transition, the organization of variables in the rows or columns of the table will start to matter. By convention, the independent variable is organized in the top row of a horizontal table and the lefthand column in a vertical table. Since the independent variable is used to calculate the dependent variable, the multiplier arrow for the constant of proportionality will point from the top to the bottom row of the table in a horizontal table and from the lefthand to the righthand column in the vertical table.
The algebraic variables and the multiplier arrow with the constant of proportionality can be used to write an algebraic equation for the proportional relationship, where the dependent variable is calculated by multiplying the independent variable by the constant of proportionality. If this equation is rewritten by solving for the other variable, the independent variable becomes the dependent variable, and vice versa. In this equation, the reciprocal of the original constant of proportionality is the coefficient of the new independent variable.
The goal in grade 7 is to appropriately apply the terms independent and dependent variables to describe the quantities in proportional relationships. In grade 8, functional relationships will be introduced, where independent and dependent variables will take on more importance.
Note that this transition will be more directly addressed in the PLC Video on graphing proportional relationships